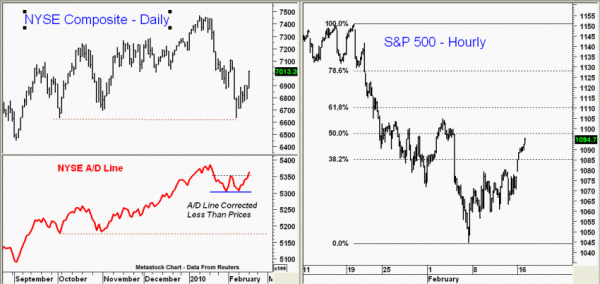
The NASDAQ short-term A/D analysis turned positive last Friday (click here for chart), and Tuesday’s gains confirmed this view. The NYSE A/D numbers have also now improved as the A/D line has moved above its previous peak. It is positive that while the NYSE Composite tested it’s October lows, the A/D has been much stronger. The hourly 50% retracement level on the S&P 500 chart is just below Tuesday’s close with the 61.8% resistance at 1110. A move above 1127 (78.6%) would confirm that the uptrend has resumed.
STRATEGIES
Is the Correction Over?
02/17/2010 10:06 am EST•1 min read

Top Pros’ Top Picks (Daily)
Subscribe to MoneyShow’s daily investment newsletter Top Pros' Top Picks and get actionable advice from our top experts, including the hottest stocks to buy and sell, ETFs and funds for short- and long-term capital appreciation, and a wide variety of dividend-paying stocks set to deliver a steady stream of safe, reliable income.

Trading Insights (3x/Week)
Get an edge on the markets with our three-times-a-week trading newsletter, Trading Insights. Receive timely trade ideas covering stocks, options, futures, and more to keep you on the right side of the action. From trading basics to advanced strategies and high-probability set-ups, the insights you need from our all-star lineup of trading pros is delivered straight to your inbox.
Trending Now
Filter By Category
Filter By Keywords
Loading...


