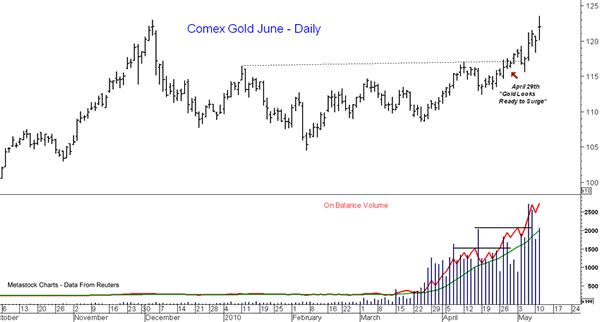
Since the December 2009 highs, it has been my view from a technical standpoint that the long-term bull market in gold was not over. This was in part due to the confirmation of the highs by the long-term OBV analysis, and in late April, the new highs in the daily OBV suggested a sharper rally. In our January Trading Lesson, I commented that “We now have targets at $1252 and $1262 with additional targets at $1352-$1362”. The chart looks bullish, so this is more likely the start—not the end—of the rally phase.
Tom Aspray, professional trader and analyst, serves as video content editor for MoneyShow.com. The views expressed here are his own.


