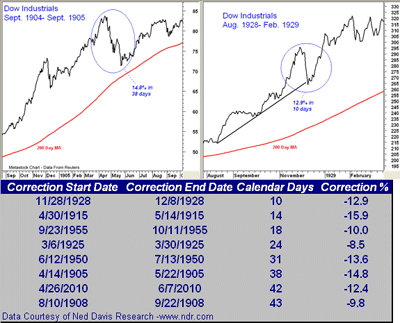
Since late May, I have been commenting about the recent dramatic change in market sentiment as well as the many divergences between the broadest market averages and those indices that have been the market leaders. Recent figures from Ned Davis Research has been excerpted in the table above and looks at other sharp, but brief market declines. The 1905 and 1928 declines above were followed by higher prices and will be discussed further in this week’s Trading Lesson.
Tom Aspray, professional trader and analyst, serves as video content editor for MoneyShow.com. The views expressed here are his own.


