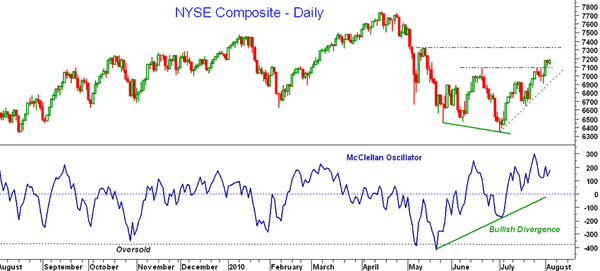
Though most traders and investors are watching for a move above the June highs in the S&P 500 at 1130 to confirm higher prices, the broader NYSE Composite has already surpassed its June highs. There is next resistance in the 7330 area. The McClellan Oscillator, a short-term A/D indicator, formed a strong bullish divergence at the July lows. It still looks positive, but a break of the uptrend would be the first sign of weakness.
Tom Aspray, professional trader and analyst, serves as video content editor for MoneyShow.com. The views expressed here are his own.


