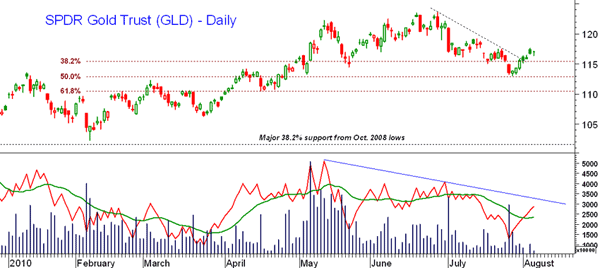
Gold's decline in late July took GLD back to stronger chart and retracement support as the 50% level at $113 was tested. Even though the recent rebound has broken the downtrend, the technical studies like the OBV are still negative. They suggest that the correction is not yet over. The 61.8% retracement support and Fibonacci projections are in the $100.40 area. A drop to this area could complete the corrective pattern.
Tom Aspray, professional trader and analyst, serves as video content editor for MoneyShow.com. The views expressed here are his own.


