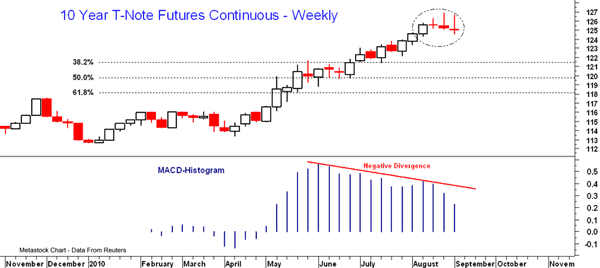
The strong rally in stocks last week put some pressure on interest rates as they moved a bit higher. Over a week ago, I noted the potential top in the T-bond futures, and last week’s action in the T-notes supports this view. The long tails on the weekly candle chart (see circle) suggest selling at the highs and the weekly MACD histogram has formed a negative divergence. It is still above zero but is declining. The key 38.2% support is in the 121 ½ area. Short term T-notes are oversold with resistance at 125 ¼.
Tom Aspray, professional trader and analyst, serves as video content editor for MoneyShow.com. The views expressed here are his own.


