
Click to Enlarge
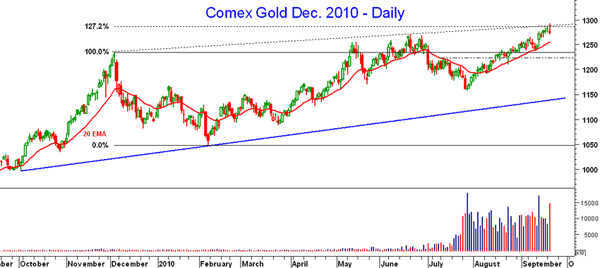
As gold has rallied about $50 in just over a week, there seems to be few, if any, analysts who are not bullish. Though this is a seasonally strong time period for gold, this bullishness makes me a bit nervous. On Tuesday, December gold tested the 127.2% Fibonacci target from the December 2009 - February 2010 correction along with trend line resistance before reversing to close lower. I still have longer-term Fibonacci targets in the $1352-$1362 area. The 20-day exponential moving average (EMA), which is often used by traders, is in the $1255 area. There is much stronger support in the $1225-$1240 area.
Tom Aspray, professional trader and analyst, serves as video content editor for MoneyShow.com. The views expressed here are his own.


