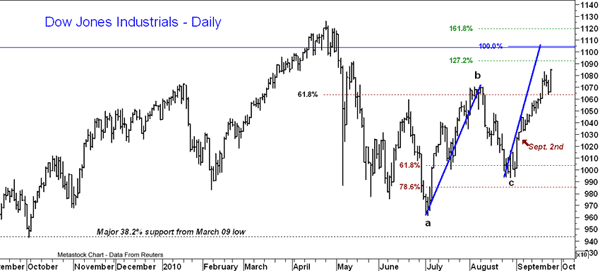
In an article written on September 2, I discussed the bullish action of the NYSE A/D line (it tracks the number of advancing and declining issues on the NYSE) as it was leading prices higher. I also gave some upside Fibonacci targets for the E-mini S&P 500 futures and the Dow. The Dow targets, as shown on the chart, were at 10,926, 11,037, and then 11,187. For the cash S&P, there are similar targets at 1155 and 1158 with much higher targets at 1185. A Dow close above 11,000 does look likely.
Tom Aspray, professional trader and analyst, serves as video content editor for MoneyShow.com. The views expressed here are his own.


