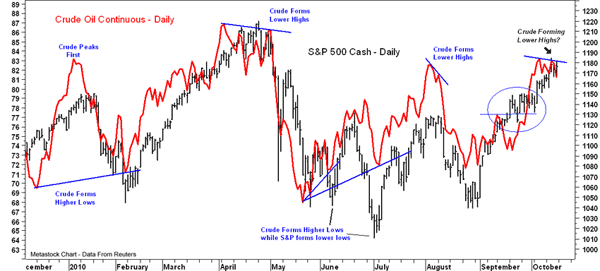
Previously, we have looked at the relationship between crude oil prices and the S&P as over the past year, crude oil prices appear to lead the S&P by a few days. The divergences are marked on the chart, and there are two to note. First, the higher lows in crude bottomed ahead of stocks in February and peaked ahead of stocks in April. The relationship has continued this fall as crude oil broke out to new rally highs ahead of the S&P 500 at the end of September (see circle). Last week, crude oil formed lower highs while the S&P 500 formed higher highs, which could be warning of a correction this week.
Tom Aspray, professional trader and analyst, serves as video content editor for MoneyShow.com. The views expressed here are his own.


