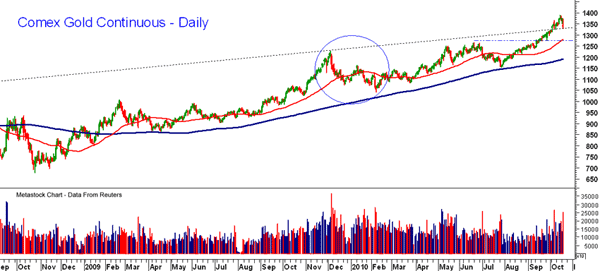
Now that gold has fallen about $60 from its recent highs, some investors and traders are already getting nervous—I even got a call from a concerned overseas investor. Those familiar with the gold market know that such corrections are frequent, and as you will see on the chart, gold declined from $1227 in December 2009 to $1060 in February 2010 (see circle). Gold has just now come back to test former trend line resistance—now support—at $1330. There is more important support in the $1260-$1280 area and the rising 50-day MA.
Tom Aspray, professional trader and analyst, serves as video content editor for MoneyShow.com. The views expressed here are his own.


