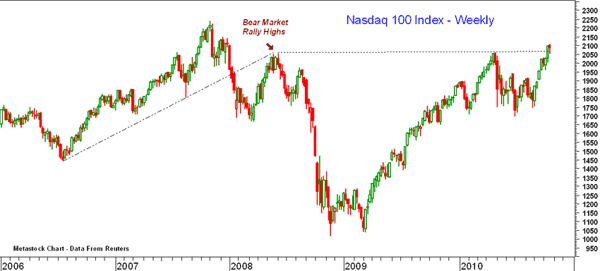
The Nasdaq 100 closed last week well above the major resistance at 2055, which goes back to May 2008 and at the time was identified as the peak of a bear market rally. Technically, this is quite significant since it creates a major band of support between 1750 and 2055. The next key resistance—from 2007—is in the 2240 area. On Tuesday’s sharp drop, selling was heavy in the tech stocks, but the Nasdaq 100 held well above the daily chart support in the 1970-2030 area.
Tom Aspray, professional trader and analyst, serves as video content editor for MoneyShow.com. The views expressed here are his own.


