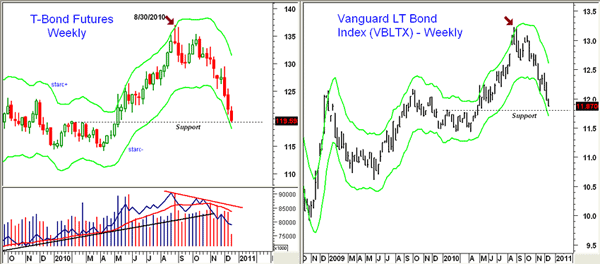
Chart Analysis: With the close on August 27, 2010, the chart of the Treasury bond futures revealed a bearish candlestick formation, indicating that bonds could be topping and that yields were going to move higher. On the right side, we have a chart of the Vanguard Long-Term Bond Index Fund (VBLTX), one of the large indexed bond funds. During the week ending August 27, both markets moved above the starc+ bands, shown in light green on both charts and explained in more detail here, indicating that it was a low-risk time to sell but a high-risk time to buy. VBLTX has dropped 9.5% since August 27 and recently tested the starc- band.
What It Means: The intermediate-trend analysis favors lower bond prices and higher yields over the coming months. Both markets are now close to stronger support and the starc- bands. This suggests that T-bonds and VBLTX are likely to stabilize or rebound over the next three to five weeks.
How to Profit: If you are looking to reduce your position in long-term bond funds such as VBLTX, you should be able to get a better price in the next few weeks. The T-bond futures could rebound to 124-125 and VBLTX could reach the $12.20-$12.40 area, which would present a better selling opportunity.
Tom Aspray, professional trader and analyst, serves as senior editor for MoneyShow.com. The views expressed here are his own.


