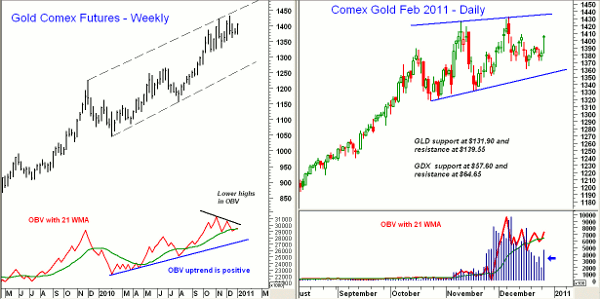
Chart Analysis: A bit over two weeks ago, I commented that the weekly on-balance volume (OBV) had formed a negative divergence on the gold futures, which despite the positive monthly volume analysis, increased the odds of a correction. Though the Market Vectors Gold Miners ETF (GDX) did correct over 8% from the highs made in early December, both the gold futures and SPDR Gold Shares (GLD) did hold well above key support. The gold futures still show a weekly OBV divergence, but Tuesday's strong close on good volume in the Comex Feb. 2011 gold futures suggests that the correction may now be over. The daily chart of gold shows a flag formation, and with a close above $1432.50, this formation has targets in the $1500 area for the gold futures. For GLD, the key resistance is at $139.55, and if overcome, it would suggest a move to the $148-$150 area. Those trading GDX should watch the resistance at $64.60. If this level is overcome, the upside targets are at $70-$72.
What It Means: The ability of the gold futures and widely held ETFs like GLD to hold support and then rally is positive. This increases the probability of another move to the upside, and new highs are looking more likely. It would take a break below the December lows to turn the daily charts negative.
How to Profit: In the earlier article, I suggested hedging long positions in GLD by selling the February 135 call against your long position in GLD. This should have been filled on the December 13 opening at 545. These calls dropped to a low of 320, but closed on Tuesday at 505. Those who did hedge their long positions by selling these calls should buy them back now for what should be a breakeven trade.
Tom Aspray, professional trader and analyst, serves as senior editor for MoneyShow.com. The views expressed here are his own.


