
Click
to Enlarge
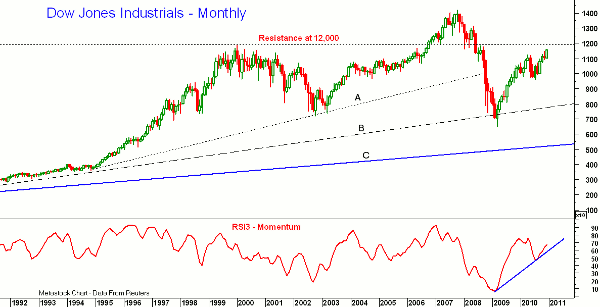
Chart Analysis: This monthly chart of the Dow Industrials shows that the RSI3 Momentum (RSI3) turned up at the end of September and is still rising. It had turned lower in May, which signaled the downtrend in prices during the summer. The RSI3 had turned up from very oversold levels at the end of March 2009, which was a very timely signal. As of the end of December 2010, the RSI3 has not yet surpassed the highs made in April and is not yet confirming the recent market strength. The long-term chart of the Dow shows that the uptrend from the 1987 and 1990 lows (line B) was briefly violated in early 2009 and now stands at 7700. Even more important support is the uptrend that goes back to the early 1980’s, which is at 5200 (line C). The chart also shows that there is a band of strong resistance in the 12,000 area, which may be a tough level to overcome, at least on the first attempt. There is first monthly support for the Dow at 10,700 with more important support at 9600.
What It Means: The rising momentum in the Dow Industrials is positive for now, but a higher monthly close in January (and likely February) is needed to keep momentum rising. Should the RSI3 turn lower, it would suggest that the Dow Industrials are ready to consolidate, if not decline.
How to Profit: The behavior of stocks in January has long been watched as it often sets the trend for the direction of stock prices for the entire year. The momentum analysis suggests that it may be important for the year as well, so if stocks fail to close higher for the month of January, it would be a good reason to re-examine the allocation in your portfolio.
Tom Aspray, professional trader and analyst, serves as senior editor for MoneyShow.com. The views expressed here are his own.


