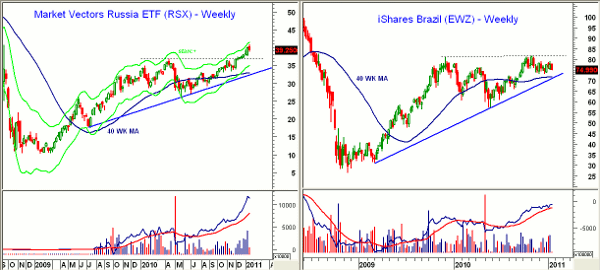
Chart Analysis: The news that $1.2 billion was pulled out of Indian equities over the past two weeks has added to the negative sentiment on many of the emerging markets. Of course, this is a rather small sum when compared to the over $29 billion that went into India in 2010. Is it time to be a contrarian? Unfortunately, we do not yet have enough reliable data to gauge how negative the sentiment has become, so let’s look at the charts instead.
Russia, as represented by the Market Vectors Russia ETF (RSX), has the best-looking chart of all the BRIC countries.
- RSX broke out above resistance at $37 last month and this level is now good support
- On-balance volume (OBV) has risen more sharply than prices, suggesting accumulation
- The next major upside target is in the $45 area
- RSX is now close to its weekly starc+ band, indicating this is a high-risk time to buy. This makes a pullback or sideways trading more likely
- Initial support is at $38-$38.50 with stronger support at $36.60-$37.20
- Key weekly resistance is at $82, and on an upside breakout, the targets are well above $100
- EWZ has weekly chart support at $73.50 with the flat 40-week moving average (MA) and the weekly uptrend at $71-$71.80
- OBV is in a solid uptrend and shows a pattern of higher highs
The Bombay Sensex Average, currently at around 19,000, could pull back to test the major breakout level at 17,800-18,400. The Shanghai Composite is down 15% from the November highs and has key support at 2560. The daily and weekly technical outlook is currently still negative.
What It Means: Russia and Brazil clearly look the best of the BRIC countries, especially on a pullback to uptrend support. The correction in the Indian stock market still looks quite normal from a technical standpoint, while the Shanghai Composite is not far above an important support level.
How to Profit: Clearly, I recommend viewing the emerging markets individually and from a technical perspective as I think viewing them as a group is a mistake. Bearish sentiment on these markets was very high in early 2009, which turned out to be a very good buying opportunity. For RSX, I would look to buy on a pullback to the $36.60-$37.25 area with a stop at $35.47. (Risk is approx. 5%.) No new recommendation for EWZ at this time, but it would look more attractive in the $68-$70 area or when the daily technical readings turn positive.
Tom Aspray, professional trader and analyst, serves as senior editor for MoneyShow.com. The views expressed here are his own.


