
Click
to Enlarge
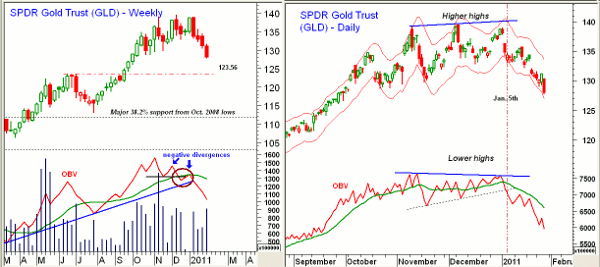
Chart Analysis: On Wednesday, as I completed an article discussing the key support levels for gold and silver (see “Gold and Silver: How Low Will They Go?”), the SPDR Gold Trust (GLD) was closing at $131.16. By the time the article was released the following day, GLD was trading in the $128.50 area and closed the day sharply lower at $127.92. The recent slide in gold prices reinforces my view that divergence analysis can be a valuable tool if applied correctly.
First of all, it is critical to look for divergences on at least two different time periods, as in strong uptrends, you will often see divergences in the daily charts but not the weekly charts. When you see both daily and weekly divergences, it’s time to pay attention.
- The weekly chart of GLD shows that the on-balance volume (OBV) peaked the week of November 6, forming lower highs over the next two months
- The drop in the OBV below the prior lows in mid-December (see circle) confirmed the divergence
- The weekly OBV failed to move above its weighted moving average (WMA) in January, which was negative
- The daily OBV peaked on November 11 and formed lower highs over the next two months
- Prices were forming higher highs, therefore, the daily OBV was also diverging
- The daily OBV violated support on January 5, confirming the divergence, and indicating that a top was likely in place
Since early in my career, I have used divergence analysis in both my investing and trading. Periodically, I see articles dismissing this type of analysis, but invariably, the focus is just on the daily data and not the weekly or monthly. Of course, it does not work every time, and you should not expect to see divergences at all key turning points in every market, but in my opinion, it is one of the best ways to identify important market turning points.
What It Means: The negative outlook from both the weekly and daily analysis indicates a further decline for GLD, and my initial downside target, as noted in the above article, is in the $125.40-$126.40 area. There are additional targets in the $123.20-$121 area, but I would expect the metals to rebound over the next one to two weeks.
How to Profit: Last Friday, I recommended buying back the GLD March 135 calls that were sold at around $4.65 to hedge long positions in GLD and selling the March 130 calls to keep long positions hedged. The March 135 should have been bought back at $2 or better, and the March 130 sold at around $4.15. Buy back the March 130 when GLD drops below $126; they closed Thursday at $2.43.
I also advised selling iShares Silver Trust (SLV) April 25 calls at $3.55 or better, which was not filled. Remember to be sure that any short call positions are covered by long positions in the underlying ETF, as naked call positions are very dangerous and clearly not recommended.
Tom Aspray, professional trader and analyst, serves as senior editor for MoneyShow.com. The views expressed here are his own.


