
Click
to Enlarge
Chart Analysis: The stock market traded briefly higher this morning as the S&P 500 pushed slightly above 1300 before a series of developments hit the market. Weaker-than-expected earnings (Ford (F), Amazon.com (AMZN), and Microsoft (MSFT)) combined with GDP numbers that missed expectations and the chaos in Egypt were more than the market could take. The major averages have plunged to their first good support levels.
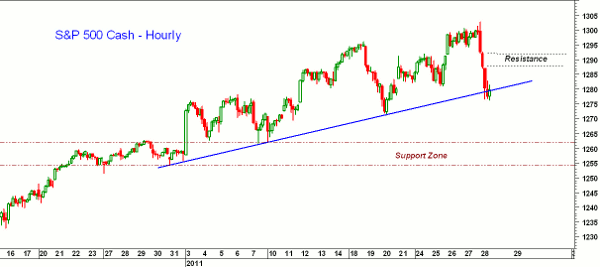
The hourly chart of the cash S&P 500 shows that the uptrend that goes back to the start of January has been broken as the 1276 level has been reached.
- There is further short-term support now at 1270-1272
- A more important support level is now in the 1254-1262 area
- Initial resistance now at 1280 with more important resistance in the 1288-1292 area
- A close this afternoon back above 1285 is needed to minimize the technical damage
What It Means: A close below 1280 will increase the chances of a drop down to the 1254-1262 area. The Advance/Decline line on the NYSE did confirm the recent highs on Thursday, so the intermediate trend remains positive, but clearly the short-term momentum has turned negative. A bounce is likely next week, but the S&P 500 needs to close back above 1290 to reassert the uptrend.
How to Profit: Today’s action suggests that investors should be able to establish new positions in broad-based ETFs or mutual funds at lower levels. It is likely that some sectors will hold up much better, and some may even buck what seems to be a downward trend for the next few weeks. As always, stops should be an integral part of your investment or trading strategy, as they can help protect your portfolio against downdrafts like we've experienced today.
Tom Aspray, professional trader and analyst, serves as senior editor for MoneyShow.com. The views expressed here are his own.


