Disciplined, successful investors know that for long-term portfolio growth, they need both an entry and an exit plan for all investments they make. In fact, when to sell is often the toughest decision. In my view, it is also important for investors to take a critical look at the fundamental press regarding their holdings. As a longtime technical analyst, I have found that the fundamentals do lag prices. A good example of this was a December 6, 2010 article on a major financial Web site calling Banco Bradesco (BBD) and Itau Unibanco (ITUB) “Among the most profitable banks.” There are at least three reasons why that was not a good time to buy and why you shouldn’t own these banks now.
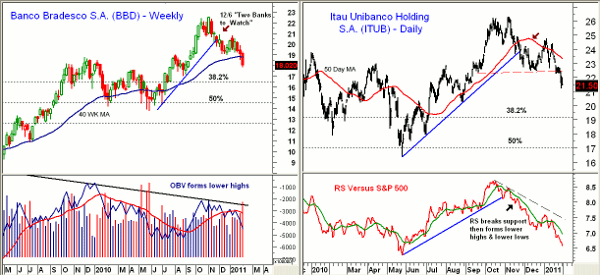
Chart Analysis: The weekly chart of BBD shows that it peaked the week of November 6 at $22.54 and is now trading at $18.02, down 20% from its highs.
- The weekly uptrend was broken at the time the article was released and weekly trend line breaks should not be ignored
- The weekly on-balance volume (OBV) was forming lower highs as BBD was making higher highs, a strong warning sign
- Observing lower highs and lower lows on the daily or weekly price charts is negative
- BBD has 38.2% support at %16.50 with 50% support at $14.50
ITUB completed a double top on November 15 when support at $24.31 (line a) was broken. It is important to invest in stocks or ETFs that are performing better than a benchmark, and for US investors, the S&P 500 average is a good one to use.
- The relative performance, or RS line, violated its uptrend in late October before the double top was completed. Before the key support (line a) was broken, the RS was already forming lower highs and lower lows
- RS line is still declining and below its weighted moving average (WMA), indicating it is still weaker that the S&P 500. This is in contrast to last summer when the RS was acting stronger
- The daily and weekly uptrends were broken in late November, and when the article was released, ITUB was not even able to rebound to its key resistance at $24.31 and the declining 50-day moving average (MA)
- The 38.2% support is at $19.20 with the 50% support at $17
What It Means: If you were long either BBD or ITUB last fall, there were at least three good reasons why it was time to either tighten your stop or take profits on part of your position. These are:
- Relative performance (or RS) analysis indicated that both banks were now performing weaker that the S&P 500, not stronger
- The volume analysis showed deterioration and some divergences, consistent with a rally that had lost momentum
- The violation of both the weekly and daily uptrends were an early warning signal that the trend was changing
The late-December rebound in BBD and ITUB back to resistance was a good opportunity to sell or tighten stops. The shift to lower highs and lower lows from higher highs and higher lows was a further reason to sell, or at least not to buy.
How to Profit: The recent bear market should have convinced the majority that investing without stops or an exit plan is hazardous to financial health. Personally, I never buy anything without putting a stop in at the same time. When I am fortunate enough to be in a winning position (which does not happen all the time), I generally have a level where I will take profits on half my position and raise the stop on the remaining portion. This not only frees up capital, but I have found it to also be psychologically positive, which is important to successful investing.
The positive fundamentals for BBD and ITUB, if they continue, could make these two banks attractive buy candidates later in the year. There are no signs yet of a bottom and I will keep my eye on the key retracement support levels going forward.
Tom Aspray, professional trader and analyst, serves as senior editor for MoneyShow.com. The views expressed here are his own.


