
Fears about rising oil prices have taken a leg out from under the energy sector, once a pillar of strength in the markets. While the mid-term trend is still up, this increases the odds of a deeper overall correction.
Higher oil prices and inflationary fears hit the stock market hard on Tuesday, and even the big oil companies were under pressure. Some investors are apparently concerned about the impact of higher prices on demand for oil. The Energy Select Sector Spyder (XLE) was down 1.9% for the day and several of its components are likely to drop even lower over the near term. The energy sector had been an area of strength for the overall market and this weakness has turned the Advance/Decline (A/D) indicators lower. This allows for a further correction within the positive intermediate-term trend.
Click to Enlarge
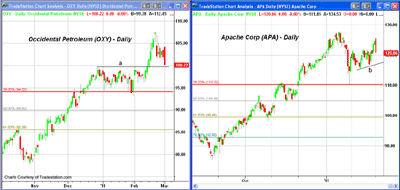
Chart Analysis:Occidental Petroleum (OXY) closed down 1.7% on Tuesday after rallying sharply in the first few minutes of trading. The daily chart shows a bearish candle formation that favors further weakness. There is next support in the $97-$99 area with the 38.2% retracement support at $94.40. The daily volume was not very heavy on Tuesday and both the daily and weekly on-balance volume (OBV) are still positive.
Another weak oil stock was Apache Corporation (APA), which opened at $125.40 but closed at $120.86, down 3% for the day. APA is now close to initial support in the $119-$120 area with trend line support (line b) near $116.40. The 38.2% retracement support level and good chart support are now in the $110 area. A decline from Tuesday’s highs that is equal to the decline from the January highs would take APA down to $108.
Click to Enlarge
The Advance/Decline numbers were about three-to-one negative on all the major averages Tuesday, causing the Advance/Decline lines (a running total of advancing minus declining issues) to turn down. The A/D lines did confirm the recent highs, so the short-term weakness is likely a correction within the overall uptrend.
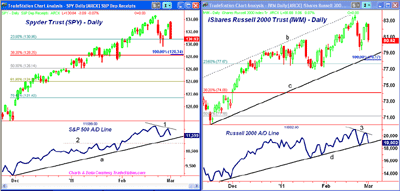
The Spyder Trust (SPY) also shows a strong reversal formation, and the E-mini futures were down another ten points after the stock market closed.
- SPY has next chart support at $129.70 with the 38.2% support level at $128.25. This coincides nicely with the equality target from the previous decline, which is at $128.34 (in blue)
- Additional support is at $127.50 and the 50% support level is at $126.14
- The A/D line has formed lower highs (line 1) but does not indicate any intermediate-term divergences
- Another day of two-to-one negative A/D numbers could drop the A/D line below last week’s lows, which would be consistent with a further decline in the A/D line to support at the January highs (line 2)
- A break of the A/D line’s uptrend, line a, is possible before the decline is over
As noted earlier, the strong new highs in the iShares Russell 2000 Trust (IWM) at $83.77 and test of the upper parallel trading channel (line b) were not supported by an equally strong new high in its A/D line.
- IWM formed a doji (reversal formation) at the highs with next support at $79.29
- The daily uptrend, line b, and the equality target are at $78.17 with additional support at $77
- 50% retracement support is at $74.30
- The Russell 2000 A/D line made marginal new highs in mid-February and has since turned down sharply. It is testing its uptrend, line d
- The A/D line could test the January lows before the correction is over
What It Means: The confirmation of the market’s recent highs—as was the case at the April 2010 highs—is a strong sign that the intermediate-term trend for the stock market is still positive. The short-term formation allows for either a test of last week’s lows or a deeper decline to more important support. The weaker relative performance of small-cap fund IWM suggests that it is likely to decline further than SPY. Once the correction is over, it may also lag on the next rally.
How to Profit: The A/D numbers over the next few days should tell us how far the current correction is likely to go. Even if the A/D lines break the recent lows, a bounce is likely by early next week. For core long-term holdings for which you have secured nice profits, you should consider using such a bounce to sell calls against your long positions. Profits in smaller-cap stocks should be protected by tighter stops. The correction in the energy sector should provide a buying opportunity in specific issues, and I will highlight such opportunities when they reach stronger support.


