Three crucial employment reports are due out this week, and those numbers could boost shares of these staffing firms, each one now trading near strong chart support.
The economic focus over the next three days will be on the job market with Wednesday morning’s ADP employment report, followed by the weekly jobless claims on Thursday, and then the monthly employment report on Friday.
The consensus forecasts continue to suggest that companies are hiring more workers and an increased hiring demand should be positive for staffing firms Robert Half International (RHI), Manpower Inc. (MAN), and Kelly Services (KELYA). Even if the numbers disappoint, each stock’s close proximity to good chart support makes for a positive risk/reward scenario.
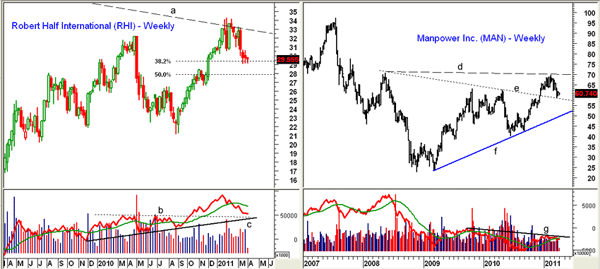
Chart Analysis: Robert Half International (RHI) is a global staffing services company that provides both temporary and full-time employees across a wide spectrum of disciplines. The weekly chart shows that the long-term downtrend going back to the 2006 highs (line a) was overcome earlier this year.
- The $32.50-$34 level now represents major resistance, and once surpassed, RHI should move to the $38 area
- The 38.2% support level at $29.44 was been tested over the past three weeks with lows ranging from $29.06 to $29.20
- Over the past two weeks, RHI has closed well off the lows and a Friday close above $29.73 would be a plus. A daily close above near-term resistance at $30.70 should turn the daily momentum positive
- The weekly on-balance volume (OBV) confirmed the breakout early in the year as it made significant new highs. The OBV has just dropped down to test support at lines b and c. The daily OBV is still negative
Manpower Inc. (MAN), a $4 billion global staffing company, just announced that it is changing its name to ManpowerGroup. The weekly chart shows that in early December, the downtrend (line e) was overcome as MAN ran to major resistance in the $70 area, line d.
- Manpower’s six-week decline has taken it back to the breakout level and the 38.2% retracement support from the 2010 lows in the $58 area. Further support now lies between $55-$56.50
- The downtrend on the daily chart shows first resistance at $62.50-$63 and a close back above $64 would be a short-term positive
- The weekly OBV has not confirmed the breakout in prices as it is still below resistance at line g. This resistance needs to be overcome to confirm a resumption of the uptrend. The daily OBV does look better as it is trying to move back above its weighted moving average (WMA)
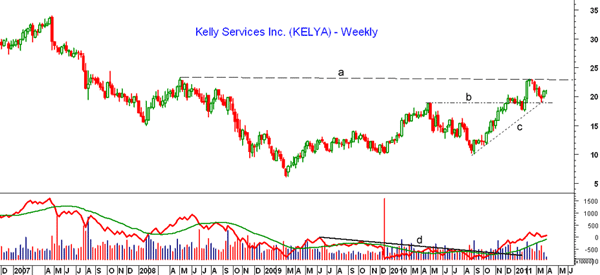
Kelly Services (KELYA) is a mid-cap company that provides outsourcing and staffing services to a wide range of industries. This is the least liquid of the three stocks with an average volume of 170,000 shares per day. The weekly chart shows that major resistance at $23 was tested earlier this year.
- KELYA tested converging support, lines b and c, in the $19 area as stocks were plunging on March 16. There is further support at $17.50
- On a move above $23 and the major 61.8% resistance level at $23.40, KELYA should rally to the $25 level, if not the stronger resistance at $27.50
- The weekly OBV overcame major resistance (line d) in November and is in a solid uptrend. With Tuesday’s higher close, the daily OBV is now close to moving back above its weighted moving average
What It Means: All three of these employment-related stocks have corrected back to first good chart and retracement support. All show positive long-term patterns of higher highs and higher lows. A continued improvement in the outlook for jobs should boost the bottom line of all three companies, and this week’s jobs data may be just that catalyst.
How to Profit: The weekly OBV patterns look the best for RHI and KELYA while the lagging volume in MAN is in contrast to the positive weekly chart pattern.
For RHI, I would buy at $29.14-$29.57 with a stop at $28.75 (risk of approx. 2.8%). On a move above $31.05, raise the stop to breakeven, and sell half the position at $32.17.
Since KEYLA has rallied sharply from the recent lows, the risk is a bit higher, and I would buy KEYLA at $20.20-$20.54 using a stop at $18.93 (risk of approx. 7.8%). On a move above $21.65, raise the stop to $19.87. Sell half the position at $22.32.
As for MAN, I would look to buy at $59.60-$60.34 with a stop at $57.83 (risk of approx. 4.2%). On a move above $62.65, raise the stop to $59.23 and sell half the position at $65.38 or better.


