Since I last looked at Pulte Group (PHM) and KB Home (KBH), the technical outlook for one of these homebuilders has improved, suggesting there may finally be some hope for this embattled sector.
Since I last covered the homebuilding stocks in early March (see Avoid These Homebuilders), the news for the homebuilders has not improved with new housing starts down 22% in February, although some surveys do report an improvement in homebuilder confidence.
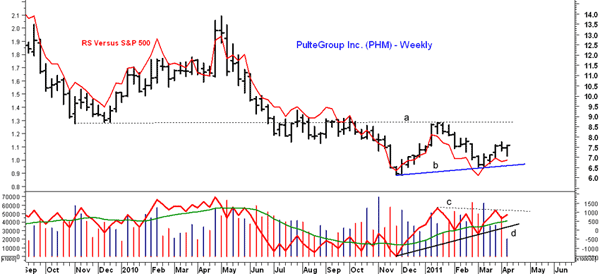
Chart Analysis: For Pulte Group (PHM), I commented last time that it had “one of the weakest charts of the homebuilders” as it had broken weekly support at $8.70 last fall (line A) and dropped to a low last November of $6.13.
- PHM declined a bit further in early March but bottomed at $6.51, well above the previous lows, line b
- There is short-term resistance now in the $8.00 area with more important resistance at $8.70 as former support is now key resistance (line a)
- The weekly on-balance volume (OBV) is acting stronger than prices as it shows a solid uptrend, line d, and is not far below its January highs (line c). A strong move above this level should confirm that a bottom is in place
- The relative strength (RS) line (in red), which looks at the relative performance of PHM compared to the S&P 500, made new lows in March, which indicates that it is still underperforming the overall market
- The RS needs to surpass its January highs to indicate bullish relative performance
- Initial support at $7.00 needs to hold to keep the short-term uptrend intact
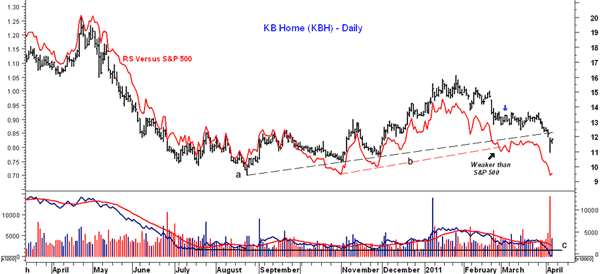
KB Home (KBH) reported widening losses on Tuesday as orders dropped 32% compared to last year. The selling in reaction to the news has been heavy as KBH traded over 14 million shares, which was well above the four million share average.
- KBH closed below the daily support, line a, on Monday in advance of Tuesday’s plunge
- Now that support in the $11.50 area has been violated, the next long-term support is in the $10 area. KBH traded as low as $6.90 in 2008
- Resistance is strong in the $12.50-$13.50 area with the weekly downtrend in the $14.40 area
- The RS analysis could have been helpful to holders of KBH as it broke its support at line b on February 28 (see arrow). This was over a month before the corresponding price support was broken
- The daily OBV has plunged below support at line c with Tuesday’s heavy volume, and while the weekly OBV is below its weighted moving average, it has not yet made new lows
What It Means: While the technical improvement in PHM is encouraging, it needs to be tempered, in my opinion, by the strength of the overall market. Clearly, the analysis of KBH suggests that it will continue to be a poor choice for any portfolio and it could easily lose another 10% over the next few months.
How to Profit: My advice last time for those who were long either PHM or KBH was to either sell their longs or use very tight stops. However, since the March 3 close, PHM is actually up 12.4% while KHB is down 11.8%.
As for the SPDR S&P Homebuilders ETF (XHB), I recommended a stop under $17.00 to protect profits on existing longs. On March 15, XHB traded down to $16.98 in the first few minutes of trading, but 30 minutes after the opening, it was back to $17.32. Hopefully buyers gave it a bit more room under $17.
As an aside, most of you probably are aware that using a stop at a round number like $17 is a bad idea. Often it is better to go four to 13 cents below any round number depending on the share price.
I have no new recommendation for PHM until the sector starts outperforming the S&P 500, though a weekly close in PHM above $8.70 would be positive. If you are long XHB, I would recommend a stop at $17.63 as the short-term RS analysis has now turned negative.


