Those who avoid overreacting to recent headlines will find favorable buying opportunities in a number of promising ETFs. Here are several risk-controlled buy set-ups.
It has been a rough week for many of the world markets. A week ago, we had the Goldman Sachs (GS) sell signal for crude oil and other commodities, followed this week by Standard & Poor’s cautionary note about the future of US debt, which caused a new round of panic selling on Monday.
I have always been skeptical when there is a widespread reaction to the opinion of one analyst, firm, or country. Most veteran traders questioned the motives of Goldman Sachs, especially after crude oil plunged 3.5% and copper declined 1.7% the following day. Goldman has earnings due out Tuesday; I wonder if they showed a profit?
The market’s reaction to S&P’s cutting of its outlook for US debt hit the US stock market hard on the opening. Selling on the opening in reaction to almost any news is a bad idea because typically prices will bounce in the next few hours, even in a bear market.
Stocks closed well off the lows and the market’s reaction seems to be overdone, as quite a bit can happen between now and 2013.
Of course, the resurfacing euro debt problems also did not help the markets, with the yield on ten-year Spanish notes hitting a ten-year high and concerns over Greece’s debt also fueling panic selling in the euro zone.
Most of the markets have pulled back into good support zones, and while the short-term trend is lower, the intermediate-term analysis suggests that investors and traders should have bought, not sold on Monday.
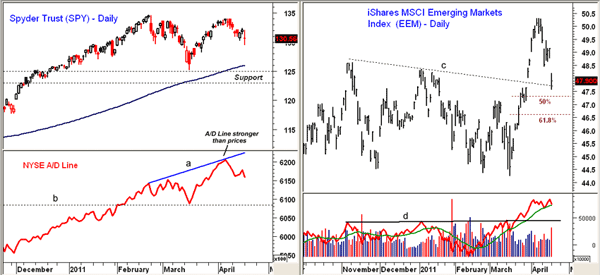
Chart Analysis: The daily chart of the Spyder Trust (SPY) shows Monday’s drop below last week’s lows. Next short-term support for SPY is in the $128.50-$129 area.
- Additional chart support is at $127.30 with key support at $125.28 and the March lows
- SPY needs to move above $132.50 to stabilize the short-term outlook, while a convincing close above $134 should signal sharply higher prices
- The NYSE Advance/Decline (A/D) line, a very broad measure of the market internals, made significant new highs in early April (line a) and is still acting stronger than prices. This is typically a very bullish sign, as the A/D line also led prices higher early last fall
- On a short-term basis, the A/D line turned higher last Friday but reversed course on Monday, so it is still in a short-term downtrend. Next support is at the March highs and more important support at line b
On April 7 (see “The 4 Best Buys in Emerging Markets”), I pointed out that the relative performance, or RS analysis, indicated that the iShares Emerging Markets Index (EEM) had started to outperform SPY. I recommended buying several emerging market ETFs on a correction, and EEM peaked at $50.30 and dropped to a low of $47.56 on Monday.
- The 50% support on the daily chart is at $47.30 with the 61.8% support at $46.60. Major chart support is now in the $44-$44.60 area
- The daily on-balance volume (OBV) is holding up much better than prices even though volume spiked on Monday. The daily OBV overcame strong resistance in March (line d), which was positive
- The weekly OBV (not shown) could drop back below its weighted moving average (WMA) with a lower close this week
- First resistance is now at $48.50-$49 with stronger resistance at $50-$50.50. Once above the April highs, EEM has initial Fibonacci targets at $52.00
NEXT: More Favorable Buy Set-Ups in Leading ETFs
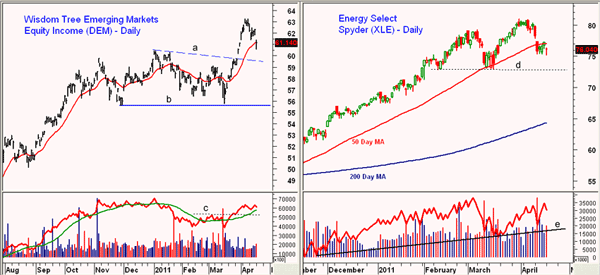
|pagebreak|One of the emerging market ETFs that I liked was The WisdomTree Emerging Markets Equity Income Fund (DEM), which recently peaked at $63.26 and carries a current yield of 3.2%.
- DEM gapped lower on Monday and is close to the December highs at $60.45, which is now first support
- The breakout level, line a, is at $59.50 with the 20-week exponential moving average (EMA) now at $59.10. There is much stronger support at $56.50- $57.50
- The OBV did overcome resistance in late March (line c) and is still above its weighted moving average
- First resistance is at $62.50, and on a move above the recent highs, the completed trading range has upside targets in the $65-$66 area
The technical outlook for June crude oil futures is still positive despite the short-term downtrend. A break below the $105.90 level is likely to signal a drop to the $103 area. The Energy Select Sector SPDR (XLE) is still in a short-term downtrend, but the longer-term analysis remains positive.
- XLE is now below its 20-day EMA with a good band of support between $73 (line d) and $75
- The weekly OBV (not shown) continues to act quite strong, while the daily OBV has turned down but is still well above strong support at line e
- Initial resistance is at last week’s gap between $77.30 and $77.87. There is much stronger resistance at $79.90-$80.37
- Long-term resistance is at $82 and then in the $85 area
What It Means: The stock market’s rebound into the close on Monday was encouraging, but the major index ETFs, especially SPY and Powershares QQQ (QQQ), which tracks the Nasdaq 100 index, need strong rallies with good A/D numbers to complete short-term bottom formations.
It is my view that the panic selling of the past week has created good buying opportunities. The nearness to good support allows us to use a reasonable stop on new positions, because after the correction, we are no longer chasing the market.
How to Profit: Several of the ETFs I have discussed recently have dropped into the recommended buy zones and continue to look attractive. Be sure to use the recommended stops.
For SPY, since the short-term momentum is still negative, I would go long at $128.88 with a stop at $124.82 (risk of approx. 3.1%).
Portfolio Update
iShares Emerging Markets Index (EEM): Monday’s open was at $48.15, so the recommended 50% buy at $48.48 was filled, as was the 50% long recommendation at $47.64 (Monday’s low was $47.56). Keep the stop at $45.88. On a move above $52.25, raise the stop to $47.63 and sell half the position at $53.30.
WisdomTree Emerging Markets Equity Income Fund (DEM): Should be 50% long at $60.68 (Monday’s low was $60.53) and add another 50% long at $59.72. Use a stop at $57.27. On a move above $64.82, raise the stop to $59.76.
iShares MSCI Thailand Market Index (THD): Fund has not reached the buying zone. Stay with the prior recommendation to go 50% long at $66.18 and 50% at $64.77 with a stop at $60.92 (risk of approx. 7%). Sell half the position at $71.72 and raise the stop on the remaining position to breakeven.
iShares MSCI Chile Investable Market Index Fund (ECH): Opened on Monday at $72.04, therefore, should be 50% long at $72.04 (buy level was $72.67) and add a 50% position at $71.64 or better with a stop at $67.48 (risk of approx. 6.5%). On a move above $77.05, raise the stop to $69.73. Sell half the position at $79.80 and raise the stop on the remaining position to breakeven.
Energy Select Sector SPDR (XLE): Should be long at $76.44-$77.07 from last week, as XLE made a new correction low of $75.04 on Monday. If not currently long, buy at $75.80 or better and use a stop at $72.72. On a close above $79.70, raise the stop to $74.47.


