Upcoming earnings from Potash of Saskatchewan could be the next critical driver of price action in fertilizer stocks. Here are key levels to watch in three sector leaders.
The agricultural commodity markets are still catching the world’s attention, with corn and wheat futures prices having doubled from the lows last summer. Soybeans are still lagging, but also up 50% in the past year.
Though there are no signs that the world’s demand for food is slowing, the S&P Fertilizer and Agricultural Chemicals Index is still 2% below the February highs. The early-2011 highs tested the resistance going back to 2009 and 2010 with the industry group roughly 50% below the all-time highs from 2008.
All of the key potash fertilizer companies, including Potash of Saskatchewan (POT), The Mosaic Company (MOS), and CF Industries Holdings (CF) are still trading well below the highs for the year. Even the surprising 144% increase in earnings from Mosaic, as reported on March 31, which beat analyst estimates, failed to push the stock higher.
With earnings from Potash due out Thursday, this industry group appears to be reaching a critical juncture.
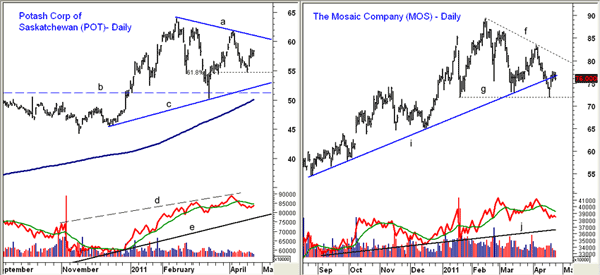
Chart Analysis: The daily chart for Potash of Saskatchewan (POT) shows a broad trading range this year with the daily downtrend, line a, now at $61 and the April highs at $61.80. POT’s high for the year was made in February at $61.96.
- The sharp plunge on March 16 took POT to a low of $50.25 as the former resistance (now support) at $51.25 (line b) was briefly broken
- POT has recently bounced from the 61.8% support at $54.68, which is now the key level to watch
- The daily on-balance volume (OBV) has made higher highs since last November (line d). It is currently below its weighted moving average (WMA) but well above its uptrend, line e
- The weekly OBV (not shown) is above its weighted moving average and is acting stronger than prices
The Mosaic Company (MOS) has key support for 2011 now in the $72 area (line g) and it has tested that level three times this year. The break of the daily uptrend, line h, is a concern, as the daily chart now shows lower highs and lower lows.
- MOS has more important support now in the $65-$67 area
- The daily OBV made a slightly lower high this month, but the higher high in late February was positive. The OBV has not yet confirmed the decline in prices
- The weekly OBV (not shown) is above its weighted moving average, but it has so far failed to move above the highs made in late 2010
- The daily downtrend (line f) is now at $81 and a move above the previous highs at $83.41 is needed to complete the corrective pattern
- There is major resistance at $86.48-$89.24
NEXT: Latest Chart for CF Industries; How to Profit in Fertilizer Stocks
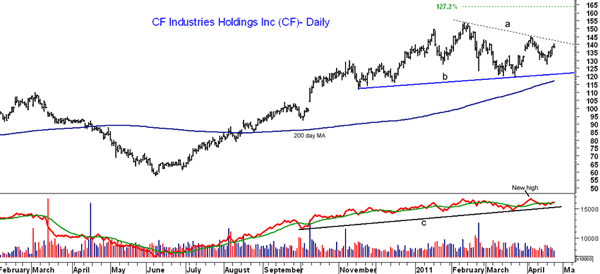
|pagebreak|CF Industries Holdings (CF) closed barely higher on Monday and is not far below the daily downtrend resistance (line a) at $142.56. The April highs at $145.25 need to be overcome to confirm a new uptrend for CF, which is scheduled to report earnings on May 2.
- If the recent highs at $153.83 are overcome, the 127.2% retracement target is at $163.70 with the all-time highs at $168-$173
- The daily OBV made new highs in early April and just moved back above its weighted moving average. It is well above the support at line c
- The weekly OBV (not shown) has moved above the February highs and is acting stronger than prices, which is bullish
- There is initial support now at $127.60-$130 with more important support now at $120
What It Means: The earnings for POT—or more importantly, the market’s reaction to those earnings—could set the tone for the fertilizer sector overall. Both POT and MOS did reach the buy levels I previously recommended on April 4, but longs in MOS were stopped out.
Longs were established in CF earlier in the year and partial profits have already been taken. The technical outlook does suggest a positive reaction to earnings from Potash, though the risk on new longs has increased.
How to Profit: Readers would have been long CF from March 23 at $122-$123.58 when CF made its low at $120.01. Half of that long position was sold on March 31 at $138.77 for a 15.2% gain. Raise the stop now from $125.44 to $127.17.
Aggressive traders could still go 50% long at $136.74 or better with the same stop (risk of approx. 7%). On a move above $144, raise the stop on all long positions to $131.88.
As for POT, buyers should go 50% long at $57.45-$58.25, as the stop at $54.18 just held on the April 18 drop to $54.68. On a move above $61.40, raise the stop to $56.82.
I don’t generally recommend new positions heading into earnings, but traders could watch the short-term support at $56.82-$57.36.
Finally, previous longs in MOS recommended at $77.90-$78.88 were stopped out at $74.89 for a 5.1% loss. The daily momentum is still negative, while the weekly analysis is still slightly positive. I have no new recommendation for MOS at this time.


