The retail sector’s outperformance has been surprising, but the current market correction brings risk, as well as potential opportunities. Here is the outlook for several of the sector’s top stocks.
One of the surprising areas of market strength since the March 2011 lows has been the retail sector. In past years, this has not been a typically strong seasonal period for the group, but the Dow Jones Retailers index is up over 10% in just two months.
Many of the big retailers have reported strong earnings in the past week, including Macy’s Inc. (M), Kohl’s Corp. (KSS), and Dillards, Inc. (DDS), but strong earnings have not boosted all the stocks in this group.
The sharp increase in gas prices has kept many investors away from these stocks, as it was expected to have a serious impact on consumer confidence and limit shopping trips to the mall. Now that crude oil prices have softened, the better-than-expected earnings have been met with some good buying.
Of course, the key question now is whether the current market correction will set up a favorable entry point on the long side, or whether now is the time to get out of these stocks.
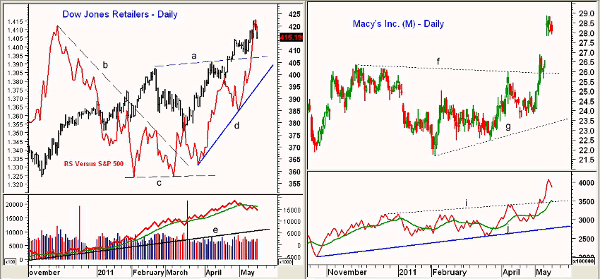
Chart Analysis: The daily chart of the Dow Jones Retailers shows a significant breakout in April above the resistance at 407 (line a), which now becomes good support.
- The relative performance analysis (RS) is positive for this group. The downtrend in the RS, line b, was broken in March, completing the double-bottom formation (line c)
- The RS turned down on Monday but is still in a solid uptrend as indicated by line b
- The daily on-balance volume (OBV) did not confirm the recent highs, as it stayed below its weighted moving average (WMA). This increases the chances of a further pullback, but the OBV is well above the long-term support at line e
- Once above the recent highs at 422, there are additional targets in the 432-435 area
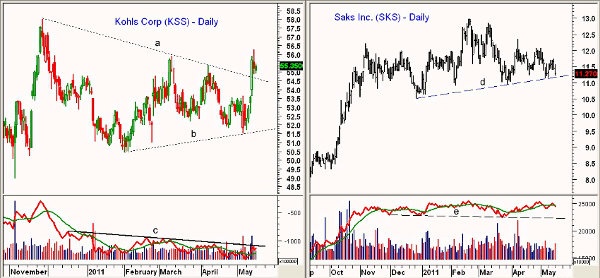
Macy’s Inc. (M) peaked in late November and declined as the holiday season approached. The daily chart shows a triangle formation, lines a and b, which was completed first in early May.
- Prices consolidated for several days before M gapped sharply higher on the much- stronger-than-expected earnings and revenue numbers last week
- The price gap is now in the $26.88-$27.87 area. Typically, this gap could be partially filled on a pullback, but I would not expect it to be completely filled
- There is very good support in the $25.50-$26 area
- The daily OBV confirmed the price action by breaking out of its trading range, lines i and j. The weekly OBV is positive, but it is still below last year’s highs
- There are upside targets from the triangle formation in the $29.50-$31 area
NEXT: Latest Chart Action for Retailers Kohls, Saks
|pagebreak|Kohl’s Corp. (KSS) also reported stronger-than-expected numbers last week, as profits rose 14% while sales numbers met analysts’ estimates. The daily chart of KSS also shows a completed triangle formation, lines a and b.
- There is next resistance for KSS at $57.24 and then at $59. The triangle has upside targets at $60.50 and then in the $63.40 area
- The daily OBV is above its weighted moving average but has not confirmed the price breakout, as it is still below resistance at line c. The weekly OBV looks stronger, but it has also not yet broken out
- There is minor support at $54.50 with much stronger support in the $53.40-$53.80 area
- A drop below the lows at $51.52 would be negative
Saks Inc. (SKS) has been in a broad trading range for most of the year despite also reporting strong earnings. SKS pushed to a high of $12.97 in February but was unable to follow through on the upside.
- SKS was weak on Monday and the daily chart formation looks toppy. A break below the support in the $10.95-$11.20 area, line d, should trigger heavier selling
- There is chart support from early in the year at $10.51, which also corresponds to the 38.2% retracement support
- The more important 50% support stands at $9.80
- The daily OBV is just barely below its weighted moving average, and a violation of the support at line e would be more negative. The weekly volume (not shown) is below its flat WMA
- There is initial resistance now at $11.70-$12.10 with stronger resistance above $12.50
What It Means: Given the prospects for lower gas prices as we start the summer and the economic recovery still intact, Macy’s and Kohls should do well this summer.
Monday’s sharp reversal in JC Penney (JCP) is a short-term negative, however, and the outlook for some of the high-end stores like Saks does not look positive.
Given the market’s current corrective phase, I would only look to buy shares of either M or KSS on a pullback to stronger support.
How to Profit: If I were long Saks (SKS), I would be somewhat nervous at this time, and I suggest placing a stop no lower than $10.87.
For Macy’s (M), go long at $26.94 with a stop at $24.67 (risk of approx. 8.4%). On a move above $29.20, raise the stop to $26.78 and sell half the position at $31.44.
For Kohls (KSS), go long at $54.18 with a stop at $51.36 (risk of approx. 5.2%). On a move above $56.40, raise the stop to $53.78 and sell half the position at $60.24.


