Market leaders like Apple, Amazon, and NetFlix can give important signals about the broader market, and with one of their charts showing a bottom, investors should take notice.
Sharply higher earnings from Dell, Inc. (DELL) boosted its stock sharply in afterhours trading, which could help the market continue the rebound from late Tuesday. The market’s ability to reverse to the upside—with the Nasdaq 100 actually closing higher— may signal that the worst of the correction is over. A strong close on Wednesday would support this view.
If the market is ready to resume its intermediate-term uptrend, the relative performance (RS) analysis suggests that the technology sector may be able to take over leadership. As I noted last week (see “2 Key Sectors Top Out”), the industrials and materials sectors are acting weaker than the overall market. Therefore, without a strong technology sector, it will be tough for the market to challenge or exceed the recent highs.
Of course, market leaders like Amazon.com (AMZN), NetFlix Inc. (NFLX), and Apple (AAPL) will be watched closely as the market tries to stabilize and move higher. The chart for one of these bellwether stocks looks as though it has indeed bottomed out.
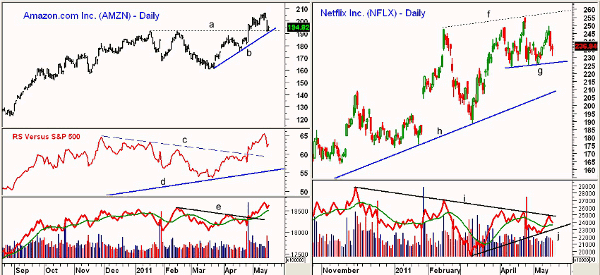
Chart Analysis: Amazon.com (AMZN) hit a high of $206.39 early Friday, and by early Monday, it was already 7% below the highs, hitting a low of $191.37 just before the close.
- The decline took AMZN back to the early-2011 highs, line a, as well as the uptrend, line b. AMZN had higher lows on Tuesday and closed up for the day
- The upside targets from the trading range breakout (line a) are in the $220-$225 area
- The RS analysis indicates that AMZN is outperforming the S&P 500, as it broke through resistance (line c) in late April. The RS is above its long-term uptrend, line d, that goes back to the 2008 lows
- The RS made a new high last week with prices, which is positive
- The daily on-balance volume (OBV) also confirmed the new highs and shows a bullish pattern, as it surpassed resistance at line e
- If this week’s lows are violated, there is further support between $181.50 and $186
NetFlix Inc. (NFLX) has been watched closely since Morgan Stanley downgraded the stock in February. It has now dropped from $247.55 to a low of $188.89 is just three weeks.
NFLX held its longer-term uptrend on this drop and made new rally highs in April at $254.98. Growing competition for the company’s business has dampened the enthusiasm for the stock.
- NFLX has developed a narrow trading range over the past two months, with good support, line g, now at $224.41-$225.30
- Initial resistance stands at last week’s high of $249.62 and then at $254.98-$258, line f
- The daily OBV has been diverging since the November 2010 highs, as it shows a pattern of lower highs (line i). It is above its weighted moving average (WMA) and now has short-term support at its uptrend, line j
- The weekly OBV (not shown) did confirm the April highs, which is more important
- If support at line g is broken, NFLX could decline to the $210 area
NEXT: See Latest Chart Action for Apple; How to Profit
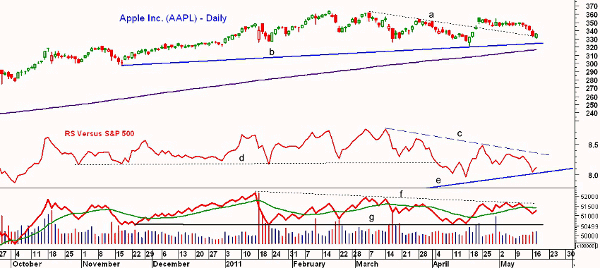
|pagebreak|Apple Inc (AAPL) has also been in a broad trading range this year, as April’s brief drop below support at $326.26 likely stopped out some longs. The decline held above the November 2010 highs, which was a positive sign.
- AAPL tested the $330 level and the former downtrend (line a) on Tuesday before closing higher. The six-month trend line support comes in at $324, with the rising 200-day moving average (MA) at $316
- The longer-term RS analysis is positive, but it came close to long-term support (line e) this week. The RS violated six-month support, line d, in April, which was a sign of weakness
- The RS needs to move through its downtrend, line c, to signal that AAPL is once again acting stronger than the S&P 500
- The daily OBV held support, line g, in April, but is still below its weighted moving average. The weekly volume (not shown) is acting weaker and is below its WMA
- There is initial resistance for AAPL at $340-$342 with stronger resistance at $350
What It Means: These three stocks have garnered quite a bit of attention, especially from the trading community, as all three bottomed ahead of the market in 2009.
The current correction in the stock market may still have further to go, but the positive intermediate-term outlook does favor an eventual move above the May highs. It will be important to watch how these stocks perform on the next rally, and clearly, AMZN looks the best from a technical perspective.
How to Profit: The weekly and daily outlook is positive for AMZN, so there is a good chance that the worst of the decline is already over. Traders can go long at $193.78 with a stop at $188.84 (risk of approx. 2.5%). On a move above $202, raise the stop to $190.84 and sell half the position at $211.86.
For NFLX, I would wait for an upside breakout in the daily OBV to signal that it is ready to test of the upper boundaries of its recent trading range. No recommendation for now.
As for AAPL, while it is clearly possible that Tuesday’s lows will hold, the technical readings are not overly strong. The action of the weekly OBV is the biggest concern, and the daily RS analysis still suggests that APPL is underperforming the S&P 500. No recommendation for AAPL at this time.


