Declining home prices and the still-gloomy housing outlook hasn’t stopped several of the top homebuilding stocks from rallying. Two in particular are setting up as low-risk buys now.
Tuesday’s release of the March S&P/Case-Shiller price index showed a drop of 3.6%, which was the largest year-to-year decline since November 2009. The decline in national home prices back to 2002 levels has many discussing a double-dip recession in housing. Sentiment on housing has also gotten worse, as 54% of Americans do not think housing will bottom until 2014.
The gloomy outlook has not impacted the homebuilders, however, as many have surged over the past few days on strong volume. The Dow Jones Homebuilding Index completed a weekly head-and-shoulders (H&S) top formation in April 2006 when the neckline in the 800 area was broken.
This industry group eventually made a low at 162 in November 2008. Since these lows, the group has traded in a wide range, but it now appears that the correction from the early-2011 highs is over.
Some of the largest homebuilders are already near resistance, while others are much closer to good support and may provide low-risk buying opportunities.
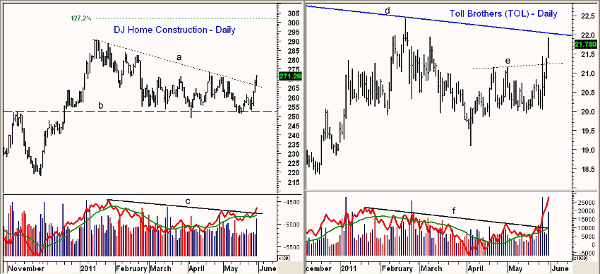
Chart Analysis: The triangle formation on the Dow Jones Home Construction group (lines a and b) was completed last Friday, and the group added further gains on Tuesday. The major support in the 253 area, which corresponds to the November 2010 highs (line b), has been tested several times over the past few months.
- There is next resistance in the 278-280 area and then at the recent highs at 290. The 127.2% retracement resistance is at 303 with long-term resistance in the 335 area
- Volume was strong on Tuesday, and the on-balance volume (OBV) has also broken through resistance at line c. The weekly OBV (not shown) is positive and above its weighted moving average (WMA)
- Near-term support is at 263-265 with stronger support in the 255-258 area
Toll Brothers Inc. (TOL) is one of the more actively traded homebuilding stocks, averaging over two million shares per day. The daily chart shows that it had been trading in a very choppy fashion over the past few months before its recent surge to the upside.
- The short-term resistance on the daily chart at $21.25 was overcome last Friday, and TOL had nice gains again on Tuesday. The longer-term downtrend, line d, goes back to the 2010 highs and is now just above $22
- There is multi-year resistance in the $23.60 area
- Volume has been very high over the past five days with almost seven million shares trading last Wednesday alone
- TOL now has initial support at $20.80-$21.25
NEXT: Strong Charts for Two Other Leading Homebuilders
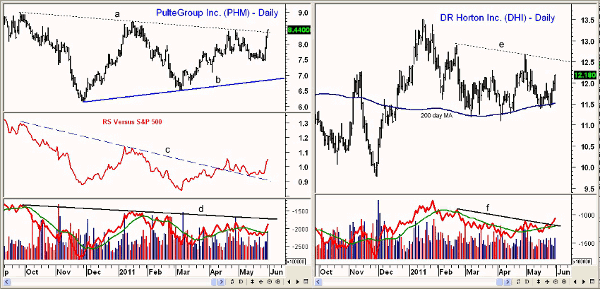
|pagebreak|PulteGroup Inc. (PHM) is another very active homebuilding stock that concentrates more on the luxury segment of the market. Tuesday’s close was just above the trend line resistance (line a).
- The completion of the triangle formation (lines a and b) would be confirmed with a close above the early-2011 highs at $8.69, which could complete a major bottom formation
- The relative performance, or RS analysis, broke through its downtrend, line c, in April, indicating the stock was starting to outperform the S&P 500. The former downtrend was again tested before the recent sharp rally
- The daily OBV has not yet surpassed its corresponding resistance at line d, but the weekly OBV (not shown) could break out today
- There is now initial support for PHM in the $7.95-$8.05 area and then at $7.80
DR Horton Inc. (DHI) is another large homebuilder, and the stock has tested its rising 200-day moving average (MA) several times since March. The daily chart has trend line resistance now in the $12.50 area. DHI made a high of $13.50 in early 2011.
- The 2008 and 2010 highs in the $15.50 area now represent major resistance. This resistance needs to be overcome to complete a major bottom
- The daily OBV has already broken its downtrend, line f, which suggests further gains for DHI. The weekly OBV is positive, but could improve sharply with high volume this week
- There is initial support for DHI in the $11.75-$11.85 area with more important support in the $11.50 area
What It Means: With housing and homebuilding in the news and given the recent trend towards renting instead of buying, the ingredients might be in place for a stronger rally in homebuilding stocks.
To signal that a major bottom has been completed, the Dow Jones Home Construction Group needs to move above the early-2010 highs. Of the three stocks covered, PulteGroup Inc. (PHM) and DR Horton Inc. (DHI) look stronger than Toll Brothers, Inc. (TOL), as TOL’s higher volatility makes risk control more difficult.
How to Profit: Given the strength of the homebuilders over the past week, I would only look to buy on a pullback, but be advised that such a pullback may not occur until next week.
Buy PulteGroup Inc. (PHM) at $8.04 with a stop at $7.42 (risk of approx. 7.4%). On a move above $9.05, raise the stop to $7.86.
Buy DR Horton Inc. (DHI) at $12.02 with a stop at $11.39 (risk of approx. 5.1%). On a move above $13.45, raise the stop to $11.86.


