The German stock market has been among the world’s top performers, and investors looking for strong technicals, good value, and high yield should consider these four plays.
Last night’s State dinner for German Chancellor Angela Merkel was reported as being low key and followed the presentation to Merkel of the Presidential Medal of Freedom. Germany could have also received an honor for being one of the best-performing stock markets over the past three months.
Since the March 16 lows, the iShares MSCI Germany Index Fund (EWG) is up 16.15% versus just 2.9% for the Spyder Trust (SPY), which tracks the S&P 500. The euro has been strong during this period, up 6.7% versus a 1.7% decline in the US dollar index.
At home, Merkel is under fire for not taking a leading role in Greece’s debt problems, and currently, there are no Germans on any of the global monetary or economic organizations.
Clearly, investors like what is going on in Germany, and several of the leading German ADRs have quite positive long-term charts. One of the ADRs yields over 7% and is trading over 15% below book value.
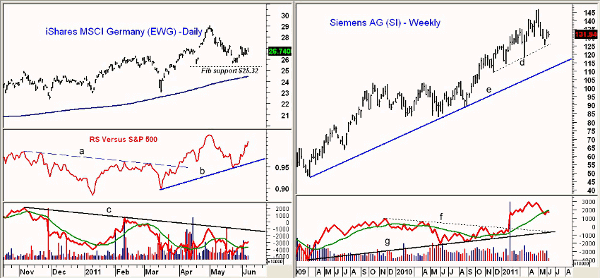
Chart Analysis: The daily chart of the iShares MSCI Germany Index Fund (EWG) shows that it made significant new highs in early May at $29.04 before dropping 11.9% into the May 23 lows at $25.58.
- EWG has bounced nicely from the lows with next key retracement resistance at $27.37-$27.76
- A close above this resistance would project a move to the $30 area
- The relative performance, or RS analysis, broke out to the upside in late March, overcoming resistance at line a. It is now in a strong uptrend, line b
- The daily on-balance volume (OBV) pattern is less positive, as it is still below its downtrend, line c. It has moved above its weighted moving average (WMA)
- If the recent lows at $25.58 are violated, there is converging Fibonacci support at $25.32, which would be expected to hold
Siemens AG (SI) is a huge, $115 billion global company that employs nearly 350,000 people. SI hit a high in early May at $146.74 and tested weekly support at $125.50 in May (line d).
- There is additional support at $122.20-$124.63 and then at $118. The weekly uptrend (line e) is at $112
- The weekly OBV made significant new highs this year after breaking through the resistance, line f, in January
- The daily OBV does allow for a test of the recent lows
- There is initial resistance now at $135-$139
NEXT: More Good German Profit Plays
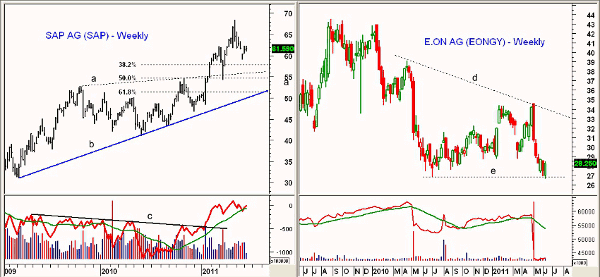
|pagebreak|SAP AG (SAP) is a business-software company worth $73 billion that does the majority of its business in Europe, although it has a global presence. It peaked at $68.39 in late April before correcting sharply to a low of $59.
- The 38.2% support from the May 2010 lows is at $57.88 with additional support in the $56.50-$57 area. The 50% retracement support is at $54.65
- The breakout level from early in the year comes in the middle of these zones at $55.85 (line a)
- The weekly OBV has turned up from its rising weighted moving average and did confirm the recent highs. The OBV surged through long-term resistance, line c, in early 2011
- There is initial resistance for SAP at $63.35-$64.50
E.ON AG (EONGY) is a multi-faceted electricity and gas company—basically, a utility company —that has interests in all types of power generation. As I noted recently, the utilities sector shows good relative performance (see “The Best Sectors for Summer”).
- The recent decision to close all nuclear plants in Germany coupled with weak gas prices has pushed EONGY slightly below the 2010 lows at $26.80
- EONGY is trying to bounce after briefly violating support lows (line e), and a higher close this week would be positive
- There is first significant resistance at $29.50 with further resistance at $30.50. The weekly downtrend, line d, is at $33.84
- There was a large volume spike in early May as EONGY went ex-dividend. The dividend amount was $2.11 for a current yield of 7.4%
What It Means: European markets are under pressure early Wednesday, as the failure of Fed chairman Ben Bernanke to mention further stimulus plans is taken as a short-term negative. German’s DAX Index is down over 1% early Wednesday, so the tracking ETF EWG, as well as these ADRs, are likely to be under pressure.
Near current levels, EONGY looks the most attractive for those who want a good yield, as it is also trading well above its book value of $33.53.
How to Profit: Go 50% long E.ON AG (EONGY) at $27.66 and 50% long at $27.02 with a stop at $25.54 (risk of approx. 6.6%). On a move above $30.40, raise the stop to $26.66.
Go 50% long iShares MSCI Germany Index Fund (EWG) at $26.02 and 50% long at $25.64 with a stop at $24.48 (risk of approx. 6.6%). On a move above $27.40, raise the stop to $25.79 and sell half the position at $28.16.
Go 50% long Siemens AG (SI) at $127.60 and 50% long at $124.30 with a stop at $117.54 (risk of approx. 6.7%). On a move above $135.55, raise the stop to $125.22, and sell half the position at $135.78.
Go 50% long SAP AG (SAP) at $59.20 and 50% long at $58.32 with a stop at $54.42 (risk of approx. 7.2%). On a move above $64.40, raise the stop to $58.66 and sell half the position at $65.28.


