Those who hastily buy gold and silver in the current environment are taking a big risk, as the charts predict further declines ahead. Right now, patience is clearly an investor’s best asset.
Gold and silver weakened on Monday, and many investors have been surprised that the metals have failed to rally given the ongoing debt problems in Greece. There seems to be a wide range of opinions about where the metals are now heading, with some convinced a major top is in place, and others looking for gold to reach $5000.
Many traders and investors who missed the move up to the May highs are itching to buy so they can participate in the next parabolic move up. They are likely to be chopped up, however, because technical damage like what occurred in the silver market will typically take at least a few months to repair.
The daily charts for the key gold and silver futures, as well as the ETFs that track both metals, show apparent continuation patterns. These should be viewed as a pause or interruption in the corrections from the May highs.
Monday’s weakness suggests that we are getting closer to the resumption of the daily downtrends. The positive weekly and monthly analysis still suggests that these will be corrections in the longer-term uptrends.
A further decline should take silver below the May lows, and I do not think that all the weak longs have been stopped out just yet. Gold is likely to hold up better on a further decline, which should eventually set up a good buying opportunity, but a patient strategy will likely be required.
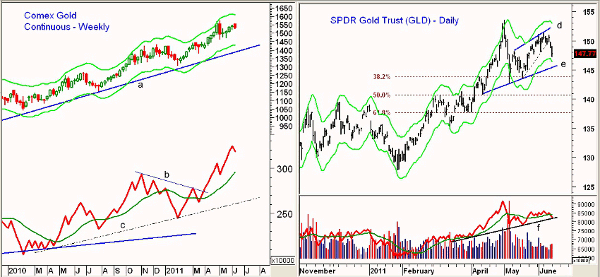
Chart Analysis: The weekly chart of gold futures (updated through Friday, June 10) shows last week’s lower close. The tight trading ranges over the past few weeks makes the market more vulnerable to a wave of selling.
- For the August contract, a break below the support at $1515-$1520 would trigger heavier selling, with first good support in the $1464-$1472 area
- The weekly Starc- band is at $1432 with the weekly trend line support in the $1400 area
- Weekly on-balance volume (OBV) made new highs two weeks ago. It has turned lower but is well above its sharply rising weighted moving average (WMA)
- The move through resistance (line b) in early April signaled the rally to the May highs. The weekly and monthly OBVs are positive for the major trend
- Daily OBV (not shown) also confirmed the recent highs but is close to dropping below its weighted moving average
- There is initial resistance for the August gold contract at $1546-$1555
The SPDR Gold Trust (GLD) broke its short-term uptrend (dashed line) last Friday. It is already close to the daily Starc- band at $146.43, while there is trend line support at $145.50, line e.
- A drop below this support should signal a pullback to the 50% support and the equality target in the $140.75 area. This also corresponds to the weekly Starc- band
- More important 61.8% support is at $137.70
- The daily OBV has dropped below its weighted moving average and closed on trend line support at line f
- Weekly OBV (not shown) did confirm the recent highs and continues to looks strong, so a deeper correction should be a buying opportunity
- The daily chart has resistance now at $150-$151.50 with major resistance at $153.60. The weekly Starc+ band is at $156.20
NEXT: Latest Chart Patterns for Silver and Mining Stocks
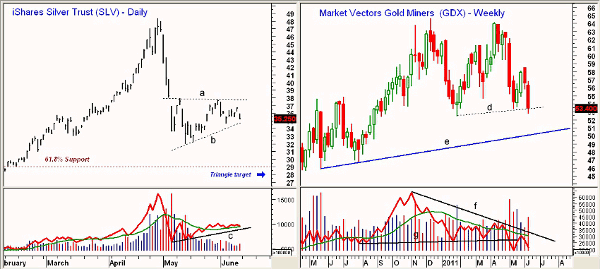
|pagebreak|The daily chart of the iShares Silver Trust (SLV) shows a triangle formation (lines a and b), which is a classic continuation pattern. There is short-term support now at $34.10-$34.60 and then at $31.97 and the May lows.
- The 61.8% retracement support from the July 2010 lows is at $29, while the completion of the triangle formation projects a decline to the $28 area
- The daily OBV is still above its weighted moving average, but a break of support at line c is likely to precede a completion of the triangle formation
- The weekly OBV (not shown) did confirm the May highs
- Initial resistance is now at $36.71 and then at $37.72 (line a). The 38.2% retracement resistance is at $38.20
The Market Vectors Gold Miners ETF (GDX) retested the late-2010 highs in April before collapsing. It dropped below the weekly support, line d, at $53.36 last week.
- The weekly uptrend from the 2010 lows is at $50, which is the next major downside target
- The weekly OBV shows a well-established downtrend, line f, as it was much weaker than prices at the recent highs. It dropped below strong support (line g) in early May
- The daily OBV (not shown) is also negative, as it shows a pattern of lower highs and lower lows
- There is first resistance now in the $55 area with much stronger resistance in the $57-$57.50 area
What It Means: The daily charts for both gold and silver futures, as well as the leading metals ETFs, show continuation patterns that favor a resumption of the decline from the April highs. Though gold may be able to hold the May lows, it is unlikely that silver will.
The analysis of the double-long and double-short silver ETFs suggest that the correction may already be underway. In my experience, continuation patterns often take longer to resolve than most expect. Therefore, after another day or so of weakness, we may see another bounce before the correction becomes more serious.
How to Profit: The weekly and daily analysis suggests that both gold and silver could bottom in late July or early August. Pinpointing a low may be tough, however, and for those not long either of the metals currently, a dollar-cost-averaging strategy looks best.
By investing equal amounts every two weeks until the end of August, you can establish a position in the metals that is consistent with your risk profile. For most, this would be no more than 5%-10% of your overall portfolio.
In late May, I recommended that traders buy SPDR Gold Trust (GLD) at $147.44, and that order was just filled on Monday. Use a stop at $146.87 and sell in the $148.74-$149.40 area, as the risk on the long side is simply too high.
I have no recommendation for the iShares Silver Trust (SLV) or Market Vectors Gold Miners ETF (GDX) at this time.


