Headlines and “talking heads” wildly switch between the bull and bear sides, and those who become too news-focused can easily miss the improving technical outlook and impending buying opportunity.
A little over a week ago (see “How Far Can Stocks Rally?”), I discussed some of the positive signs from the market internals, which suggested that the market was bottoming out. I also noted that there was a high level of bearish sentiment evident from both the individual and professional investors.
The market’s collapse the following day in reaction to plunging crude oil prices just added to the prevailing negative sentiment. Anyone watching the financial news networks, like CNBC, could only conclude that the stock market was the last place to put their money.
Therefore, I had to chuckle yesterday when a respected colleague and long-term trader called me in amazement over what he had observed on CNBC. He wanted to double check with me that he had not had some kind of Rip Van Winkle experience, as he observed that some analysts who were very negative on the stock market just a few days ago now sounded like lifelong bulls.
Clearly, trying to base your investment decision by randomly following a TV analyst is not a good idea. There are many very good independent analysts who appear on CNBC, however, and if you do your due diligence, you will find that some give very good advice.
The technical outlook for the stock market has improved, and it now suggests that last week’s lows were significant. Since the major averages are now closer to significant resistance, a pullback is likely. Once the market corrects, it will be important to watch the market internals, because a pullback should provide a good buying opportunity.
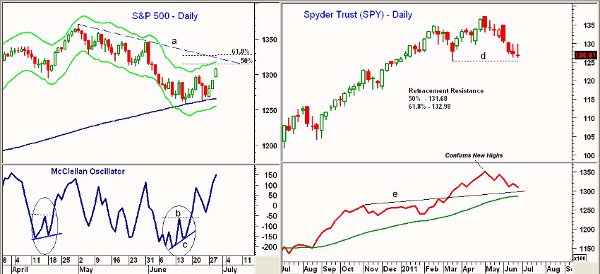
Chart Analysis: The daily chart of the S&P 500 shows that after exceeding the 38.2% resistance at 1301, we are now very close to the 50% resistance at 1314.28. The daily Starc+ band is at 1318.
- The daily downtrend, line a, is just a bit higher at 1324 with the 61.8% resistance level now at 1327.55
- Last week, I noted the bullish formation in the McClellan Oscillator, which is one of my favorite short-term Advance/Decline (A/D) indicators. It formed a pattern of higher highs and higher lows, which was consistent with a market bottom
- I was looking for a pullback in the McClellan Oscillator to the -50 area. Last Friday, it hit -31.6 before turning higher. It has now exceeded the prior peaks and is at moderately overbought levels
- There is now first good support in the 1290-1296 area with key support at 1276-1283
The weekly chart of the Spyder Trust (SPY) shows last week’s lower close with key support still at $125.28 and the March lows (line d).
- If SPY can close this week above the prior three-week highs at $130.36, it will improve the technical outlook
- SPY has 50% retracement resistance at $131.68 with the 61.8% resistance at $132.98. Expect those who are bearish on the market to be selling once these levels are reached
- A more important indicator to watch is the weekly NYSE A/D line. It confirmed the recent highs but now shows a short-term pattern of lower highs and lower lows
- The A/D is close to more important support and is likely to turn higher this week. A move in the A/D line above the prior highs would be consistent with a resumption of the uptrend
- There is first good support in the $127.90-$129 area
NEXT: Dow Industrials, Nasdaq Show Signs of Strength
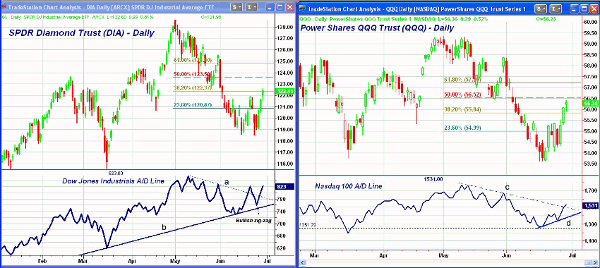
|pagebreak|The daily chart of the SPDR Diamond Trust (DIA), which tracks the Dow Jones Industrial Average, shows that it has rebounded sharply after making marginal new lows last Thursday at $118.49.
- DIA closed Wednesday above the 38.2% resistance level with the 50% retracement resistance at $123.58. The key 61.8% level is at $124.80
- The Dow Industrials’ A/D line broke its downtrend, line a, last week. On Thursday’s low (June 23), the A/D line made a higher low, therefore forming a bullish divergence
- This formation has been confirmed by the move above the previous peak
- The A/D line did make new highs in May, which confirmed the intermediate-term uptrend for the Dow Industrials
- There is initial support now at $120.40-$121.25 with more important support now at $119
The technology-heavy Nasdaq 100, as represented by the PowerShares QQQ Trust (QQQ), has been showing better relative strength since mid-June. Last Thursday’s low at $54.06 was well above the multiple prior lows at $53.62.
- The 50% resistance level is just above Wednesday’s high at $56.52 with the 61.8% retracement resistance at $57.20
- The A/D line did not form a positive divergence at the lows, but it is in a short-term uptrend, line d. The move through the downtrend, line c, is positive
- There is first good support for QQQ at $55.00-$55.30 with stronger support at $54
What It Means: The completion of the bottom formations in the short-term A/D indicators is a short-term positive for the markets. The ability of the A/D lines for the NYSE, S&P 500, Dow Industrials, and Russell 2000 to all break their respective downtrends does suggest that a more important bottom is in place. The extent of the selling on the first pullback will tell us more.
How to Profit: Once the current rally tops out, I would look for a 38.2% retracement of the recent rally to find a good entry level to buy. If my analysis is correct, the decline should only last a couple days.


