There is substantial upside potential in rare earth mineral stocks, and though a decisive bottom is not yet in place, risk-controlled entry points are evident for three leading producers.
Tuesday’s announcement from the Geneva-based World Trade Organization (WTO) found that China “Violated international trade law by artificially restricting exports of nine raw materials.” These raw materials are critical to the production of aluminum, steel, and chemicals.
Though the rare earth minerals were not included in the ruling, it is thought to set a precedent for an outstanding complaint against China for restricting the export of 17 rare earth minerals. Last year, China temporarily halted exports of rare earth minerals to Japan.
Over the weekend, it was also reported that Japanese experts have found a large deposit of rare earth minerals on the floor of the Pacific Ocean. The estimated size of the mineral discovery is estimated to be 1,000 times more than the current proven reserves, which are mostly located in China.
In an early-June article, “Sweet Spot for Rare Earth Stocks,” I was looking for a further decline in the rare earth stocks before a bottom could be completed. These stocks did drop into the middle of June but have since rallied sharply, and some rare earth minerals recently doubled in price amid reports of apparent hoarding. But have the rare earth stocks now completed a significant bottom?
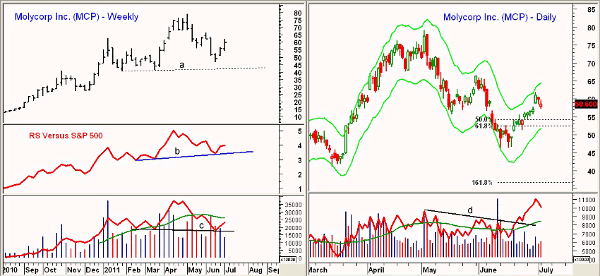
Chart Analysis: Molycorp (MCP) peaked in April at $79.16 and hit a low on June 13 of $46.40. This was a 41.4% decline from the highs. The recent rally stalled below $62 with the 50% retracement resistance at $62.88.
- The weekly chart shows the early-June high at $66.30, and a close above this level would confirm that the correction is over
- The weekly relative performance, or RS analysis, has turned up over the past few weeks after holding support at line b. A move above the June high will indicate that MCP is once again leading the S&P 500
- The weekly on-balance volume (OBV) confirmed the April highs but is currently below its flat weighted moving average (WMA). Key weekly OBV support is at line c
- There is key support on the weekly chart at $42.20 (line a) down to the 2011 lows at $40.25
The daily chart of MCP shows that the daily Starc+ band was tested last week. There is short-term support now in the $55.77-$56.35 area, which includes the 38.2% support level.
- The 50% support stands at $54.22 with the 61.8% support at $52.37. The daily Starc- band is now at $51.80
- The daily OBV broke through its downtrend, line c, on June 21 with the close at $53.05. It could pull back to its rising WMA on a further correction
NEXT: More Rare Earth Stocks Trying to Bottom
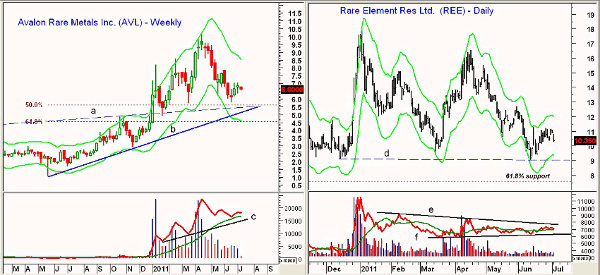
|pagebreak|Avalon Rare Metals, Inc. (AVL) tested the weekly Starc+ band in April with its high of $10.11 and came fairly close to the weekly Starc- band in June with its low of $5.82. AVL corrected 42.4% from its high.
- AVL’s rally from the June lows has stalled in the $7 area with the 38.2% retracement resistance and the daily Starc+ band at $7.50
- The 50% retracement resistance is at $8.03 with the 61.8% resistance level at $8.50
- After making new highs in April, the weekly OBV has been holding above its rising weighted moving average. It has further support at line c. The daily OBV (not shown) is currently neutral
- There is minor support at last week’s low of $6.39 with further support at $6.19. The major 50% retracement support is at $5.60 with chart support, line a, in the $5.45 area
- The longer-term uptrend, line b, is now at $5.14 with the 61.8% support and the weekly Starc- band in the $4.54 area
Rare Element Resources Ltd (REE) dropped to a low of $9.00, line d, on June 13. The major 61.8% support stands at $8.60. In early 2011, REE hit a high of $17.92.
- The bounce from the lows has been weak, as the stock has stalled at $11.23, well below the 38.2% resistance at $12.43. The daily Starc+ band is just above $12
- REE was weak on Tuesday (July 5), and short-term support now stands at $10.16 with a stronger band of support at $9.75-$9.85. The daily Starc- band is at $9.35
- The daily OBV is still locked in a trading range, lines e and f, and a breakout from this range should be significant for the short-term trend
- The weekly OBV (not shown) is still positive
What It Means: Though one can make a case that the long-term fundamental picture for rare earth stocks is positive, the near-term technical outlook does allow for one more drop back to or even below the June lows before a sustainable bottom is in place.
The significant upside potential does warrant several risk-controlled (5%-6%) buying attempts in order to establish new long positions.
How to Profit: I previously recommended going 50% long Molycorp (MCP) at $51.86 and 50% long at $50.66. Both those positions were stopped out at $48.76 for a 4.9% loss.
Buyers could now go 50% long MCP at $54.46 and 50% long at $54.08 with a stop at $51.29 (risk of approx. 5.5%). On a move above $62.05, raise the stop to $55.36.
Previous buyers should be 50% long Rare Element Resources Ltd (REE) at $9.77 and 50% long at $9.29. Raise the stop on that position from $8.83 to $9.69. On a move above $11.42, raise the stop to $10.74.
For Avalon Rare Metals Inc. (AVL), the original buying zone at $5.52 was not hit. Go 50% long at $5.72 and 50% long at $5.52 with a stop at $5.23 (risk of approx. 6.9%). On a move above $7.10, raise the stop to $5.86.


