Retail typically outperforms the market from September onward, and the shares of two low-cost retailers may soon present favorable buy opportunities.
The 0.5% rise in July consumer spending helped give stocks a boost on Monday, as it was the best number since December 2009. Tuesday’s consumer confidence numbers are unlikely to be as positive.
The market’s strength following Friday’s impressive reversal clearly got some of those on the short side a bit nervous. The Advance/Decline (A/D) lines on the major averages are now rising more sharply, but it is still too early to tell if they have really bottomed out.
The bear flag formations discussed last week are still intact, but do allow for a rally in the S&P 500 to the 1225-1230 area. It will be the strength of any pullback once stronger resistance is reached that will shed light on the intermediate term.
See related: How to Get Started in Chart Reading
During the recent market decline, there have been several market sectors that have performed better than the S&P 500. One such sector that is now entering a strong seasonal period is retail, and while one big-name stock is encountering strong resistance, two others are looking much more attractive.
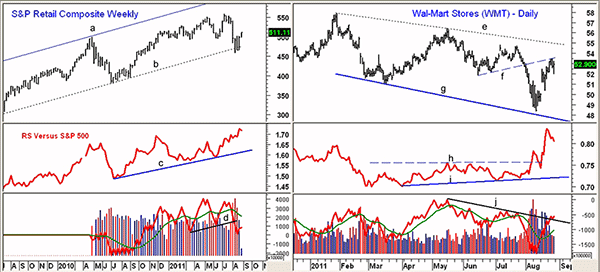
Chart Analysis: The S&P Retail Composite is down 8.5% since the July highs, which is better than the 10.7% decline in the S&P 500 during that time.
- The long-term uptrend, line b, held in early August, and the weekly support in the 455 to 500 area looks quite strong
- The relative performance, or RS analysis, has remained strong over the past few months, as it has just made new highs. It is well above long-term support at line c
- The volume was heavy on the early-August decline and the weekly on-balance volume (OBV) violated support at line d. It has turned up but is well below its declining weighted moving average (WMA)
- The daily OBV (not shown) looks strong, as it confirmed Monday’s breakout above the previous highs
- There is next resistance at 535 and then in the 550-560 area. The upper boundary of the trading channel, line a, is in the 590-610 area.
Wal-Mart Stores (WMT) is probably one of the most widely watched retail companies, and the stock has had a nice run over the past two weeks. From the August 10 closing low of $48.10, WMT is up close to 10%.
- The former uptrend from the June lows, line f, has now been reached, with stronger resistance and the daily downtrend (line e) in the $54-$55 area
- The daily chart still shows a pattern of lower highs and lower lows, line g
- Daily RS analysis completed its bottom formation in early August when it overcame the resistance at line h
- The daily OBV has risen well above its weighted moving average and has just broken its downtrend, line j
- There is first good support in the $50.40-$51 area
NEXT: Two Solid Retail Stocks Worth a Look
|pagebreak|Target Corporation (TGT) is also up 10% from the August lows but is still well below the January high at $60.97.
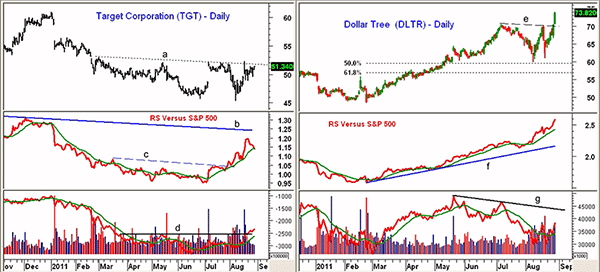
- TGT is now just below the resistance at $51.80-$52.73 (line a) that goes back to March
- A break through this resistance would signal a move to the 50% retracement resistance at $54.57
- The RS analysis has already broken out to the upside, as it overcame key resistance (line c) early in August. It is above its rising WMA but below the long term downtrend, line b
- The daily OBV is acting stronger than prices, as it has overcome resistance at line d
- There is initial support now at $50.30-$49.20 with further support at $48.50
One of the best-performing retail stocks is Dollar Tree (DLTR), which broke through two-month resistance, line e, on Monday. Last week, the company announced a $500 million repurchase agreement.
- If the current rally is equal to the rally from the February lows to the July lows, DLTR could reach the $80-$82 area
- The RS analysis has been in a solid uptrend since last spring, line f, and has just turned up sharply
- Though volume on Monday’s breakout was well above average, the daily OBV is still in a downtrend, line g. It is well above its weighted moving average
- The weekly OBV (not shown) is very positive
- There is initial support now at $70.80-$69.50 with stronger support in the $67.50-$66.30 range.
What It Means: The retail sector generally outperforms the overall market from September through December, and while the health of the consumer is still in doubt, the lower-cost retailers should be a safer bet.
The RS analysis forecast the recent strength of Dollar Tree (DLTR), which I would only recommend buying on a setback, as it is now close to its weekly Starc+ band.
Target Corporation (TGT) does look ready to break out, while Wal-Mart Stores (WMT) is too close to major resistance and still shows a longer-term downtrend.
How to Profit: For Target Corporation (TGT), go long at $50.34 with a stop at $47.52 (risk of approx. 5.5%). Sell half the position at $54.36 and raise the stop to $51.22.
For Dollar Tree (DLTR), only go long at $71.06 or better with a stop $65.54 (risk of approx. 7.6%). Cancel the order if $75.50 is hit first.


