Despite the recent rally, big casino stocks are facing strong resistance and are likely to lag the overall market. Focus instead on stronger sectors like retail and technology for new buying.
The general pessimism over the prospects for the economy and the health of the consumer has pressured casino stocks over the past few months. The data from Las Vegas does look a bit more positive than prices of the big casino stocks, however.
Even though gambling revenues fell 8.7% in August, it was mainly attributed to drop in baccarat revenues, as other gaming revenues showed a 5.7% gain. Room rates and the number of visitors are increasing, which is also encouraging.
The main casino and gambling stocks have rebounded sharply from last week’s lows, but are now back to strong resistance. A look at the broad industry group and a few of the key players suggests this sector will continue to be weaker than the overall market.
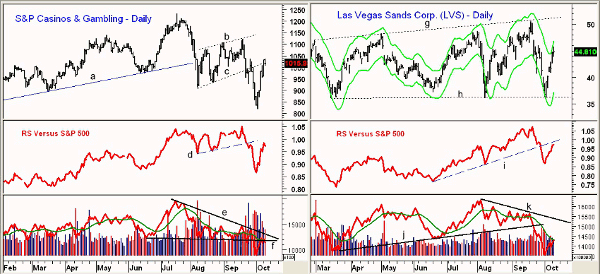
Chart Analysis: The S&P Casinos and Gambling Index peaked at 1233 in July and last week hit a low of 816, which represented almost a 34% decline from the highs. It has rallied over 24% in the past week.
- The chart shows that the resistance from the completed flag formation, lines b and c, in the 1020-1050 area, has been reached. There is much stronger resistance in the 1115 area
- The longer-term uptrend for the group, line a, was broken in August
- The relative performance, or RS analysis, violated support, line d, in September, and has now formed lower lows
- The daily on-balance volume (OBV) formed lower lows (line e) and violated support (line f) before the recent plunge
- There is initial support in the 900-930 area
Las Vegas Sands Corp (LVS) has been in a broad trading range for most of the year with resistance, line g, in the $48-$51 area and support at $36 (line h). The daily Starc+ band has been tested this week.
- There is additional resistance in the $46.50-$48.50 area
- The RS line has just rallied back to its former uptrend, line i, which is now resistance
- The daily OBV formed a negative divergence at the recent highs, line k, which was confirmed by the break of support that goes back to March (line j)
- There is now minor support in the $42 area with stronger support at $39-$40
NEXT: Latest Chart Patterns for 2 More Top Casino Stocks
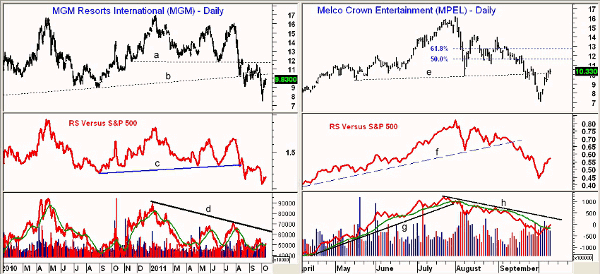
|pagebreak|MGM Resorts International (MGM) violated the 2010 lows at $8.92 by a convincing margin when it hit a low of $7.40. This represented a 50%+ drop from the July highs at $15.91.
- The daily chart shows that MGM dropped to new lows for the year when it broke support, line a, in August. Soon after, the long-term support, line b, was also violated
- This creates a band of strong resistance from $10.40-$11.75
- The RS had been in a broad trading range for most of the past two years before breaking below support at line c
- The daily OBV has been acting weaker than prices, as it has formed lower highs, line d. So far, the volume has not been impressive on the recent rally
- The weekly OBV (not shown) is negative and well below its weighted moving average (WMA)
Melco Crown Entertainment (MPEL) after peaking at $16.15, dropped in five days to a low of $9.76—a 39.5% drop. The revenues for MPEL come from gambling activity in Macao, which is still acting strong.
- MPEL made further new lows at $7.05 last week before rebounding back to former support, line e, which is now resistance
- Once above the resistance at $10.38, the 50% Fibonacci retracement resistance is at $11.60 with the 61.8% retracement resistance at $12.77
- The RS analysis bottomed in September 2010 but topped out last month as the uptrend, line f, was broken. It now shows a pattern of lower lows
- The daily OBV formed a very slight negative divergence in early August and then dropped through its uptrend, line g
- The daily OBV is now in a well-established downtrend, line h, though it has just moved back above its declining weighted moving average
- The weekly OBV (not shown) is negative
What It Means: The technical analysis for the gambling and casino stocks shows no signs yet that they are ready to outperform the S&P 500. Though they can still move higher with the overall market, there has been no indication that they have bottomed.
It is likely to take more time before bottom formations could be completed, but the exception may be Melco Crown Entertainment (MPEL), as a solid recovery in China would be very positive for this stock.
How to Profit: Those who are long Las Vegas Sands Corp (LVS) or MGM Resorts International (MGM) should use the current rally to reduce or close out their positions. I think there are better opportunities in the technology and retail sectors, as the RS analysis shows that both sectors are acting stronger than the S&P 500.


