
These semiconductor stocks show bullish chart patterns and are poised to beat the overall market. Here are risk-controlled entry points to watch for in each one.
The strength seen in the Nasdaq 100 and in many technology stocks since the August lows continues to suggest that tech will be one of the strongest industry groups as we head into the end of the year.
As is often the case, the technical outlook and some of the fundamental forecasts are not in agreement. One semiconductor industry leader, Morris Chang, who is the chairman and CEO of Taiwan Semiconductor Manufacturing Ltd. (TSM), just recently painted a very dismal outlook not only for the economy but for the semiconductor industry.
In fact, many semiconductor companies have already cut their sales and margin estimates for the fourth quarter. Still, there are several stocks in this group that are leading the market higher.
For those who are not convinced of the value of relative performance, or RS analysis, I would point out that the RS analysis of the financial sector was negative early in the year, well before the fundamentals weakened.
These four semiconductor stocks have broken out of their base formations and are acting stronger than the overall market. The current market pullback should provide good buying opportunities.
Click to Enlarge
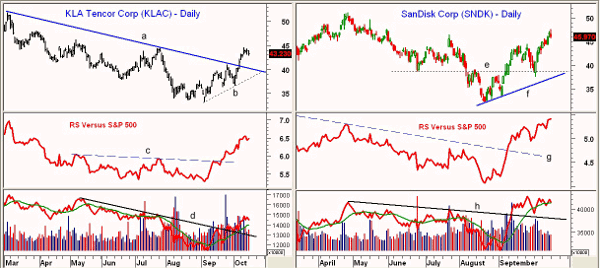
Chart Analysis: KLA-Tencor Corporation (KLAC) is a $7.2 billion semiconductor equipment and materials stock that peaked in February at $49.92 and hit a low of $33.20 in early September. It currently yields 3.2%.
- The daily chart shows that the downtrend, line a, was broken last week, and this represents first support in the $40.30 area. This also corresponds to the 38.2% Fibonacci support
- The 50% support is at $39 with the daily uptrend, line b, at $38.30
- The relative performance completed a bottom formation in late September when it overcame significant resistance at line c
- The daily on-balance volume (OBV) moved through its downtrend, line d, in early October, but was already above its rising weighted moving average (WMA)
- The weekly OBV (not shown) is positive, as it has broken its downtrend and is above its weighted moving average
- A close above the $45 level should signal a test of the February highs with the 127.2% upside target at $57.20
SanDisk Corp. (SNDK) is an $11 billion flash memory company that reports earnings on Thursday, October 20. The stock has been very strong over the past few months and is up 42.5% from the August lows at $32.24.
- SNDK closed down 1.75% on Tuesday with next support in the $44.50 area. The 38.2% Fibonacci retracement support is at $41.80 with the 50% support at $40.00
- There is converging chart support, lines e and f, in the $38-$39 area
- The downtrend in the RS (line g) goes back to February 2011 and was overcome on September 12
- The volume was strong in early September and the OBV overcame resistance at line h
- The weekly OBV (not shown) is positive but is not acting stronger than prices
NEXT: 2 More Chip Stocks Beating the Market |pagebreak|
Click to Enlarge
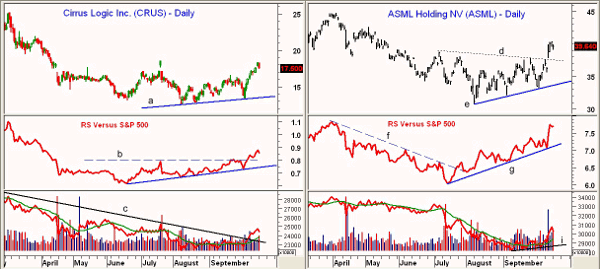
Cirrus Logic Inc. (CRUS) is a $1.1 billion specialized semiconductor company that will report earnings on Wednesday, August 19. Most analysts are expecting a slight improvement over the last quarter. Its audio chip apparently plays a significant role in the new Siri audio feature of the iPhone 4S.
- The daily chart of CRUS shows a shallow uptrend from the August lows, line a. The next major resistance is in the $20.40-$21.40 area
- The RS has broken above its key resistance, line b, while prices have not. The RS bottomed in June
- The daily OBV has moved through its downtrend, line c, which goes back to the February highs at $25.48
- There is first good support in the $16.60 area with the 38.2% Fibonacci retracement support at $16.15
- The more important 50% support is in the $15.50 area
ASML Holding NV (ASML) is the largest maker of semiconductor lithography machines that map out circuits on silicon wafer chips. It is based in the Netherlands and earnings last week were above forecasts.
- ASML broke out through resistance last week following earnings, reaching a high of $40.33 and testing its 61.8% Fibonacci retracement resistance. There is further resistance at $41.75
- The RS analysis broke its downtrend, line f, in July, and is in a strong uptrend (line g). It did make a new high with prices
- The daily OBV shows a nice rounded bottom formation with support at line i
- The weekly relative performance and OBV (not shown) do show formations consistent with a weekly bottom formation
- There is initial support for ASML at $37.70 and then at $36.50 with the daily uptrend, line e, at $33.60
What It Means: The pullback in the stock market likely has further to go. Once the correction is over I do expect the stock market to move above last week’s highs and technology stocks, like the semiconductors, should help lead the market higher.
How to Profit: For KLA-Tencor Corporation (KLAC), go 50% long at $40.36 and 50% long at $39.66 with a stop at $36.34 (risk of approx. 9.1%).
For SanDisk Corp. (SNDK), go 50% long at $41.88 and 50% long at $40.46 with a stop at $37.22 (risk of approx. 9.7%).
For Cirrus Logic Inc. (CRUS), go 50% long at $16.16 and 50% long at $15.56 with a stop at $14.25 (risk of approx. 9.8%).
For ASML Holding NV (ASML), go 50% long at $37.64 and 50% long at $36.44 with a stop at $34.12 (risk of approx. 7.8%).


