
Bullish signals from the oil futures market suggest the economy and stocks may be healthier than many believe, and two oil ETFs are likely to hold support and head higher.
December crude oil futures hit a low of $75 per barrel in early October and closed Tuesday at $93.47. This is a gain of over 24% through Tuesday's close, while the Spyder Trust (SPY) has gained just over 14% during that time.
More importantly, the December 2011 crude contract is trading above the January 2012 contract. This is the first time this has occurred since November 2008. With crude oil moving into "backwardation" (the nearby contracts are higher than the further-out contracts), it indicates that the market believes demand will be greater than supply going forward. The December contract for 2011 is trading $1.47 above the December 2012 contract.
Part of this rise can be attributed to the encouraging numbers from the Far East. There are signs that Chinese manufacturing may improve this month for the first time since June, and Japanese exports have also picked up, which is a bit more encouraging.
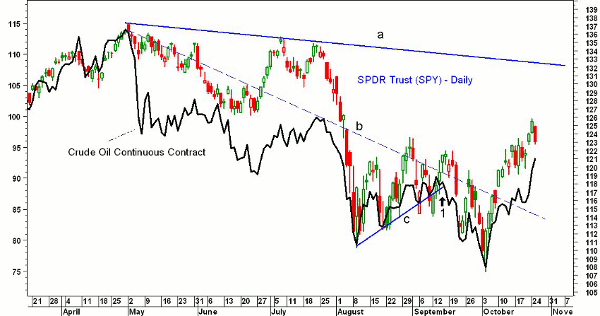
For many years, I've compared the chart patterns of the crude oil futures with those of the S&P 500, or the Spyder Trust (SPY). I have found many instances where crude oil tops or bottoms ahead of the S&P 500. Often, the two markets will show similar chart formations, but one of them will be completed ahead of the other.
In early September, I noted that the rebound in crude oil appeared to over, which suggested that the S&P was also likely to turn lower.
The backwardation in crude oil and the long-term developments in the crude oil chart may be giving important signals for stock investors, however, the bottom formations in two important oil industry ETFs have not yet been confirmed, so the extent of the current pullback will be important.
Click to Enlarge
Chart Analysis: The above chart of the continuous crude oil contract and SPY goes back to the high made in April 2011. The downtrend in crude oil, line b, connects the April 29 and July highs.
- This downtrend was broken on October 14, and crude oil has since rallied over $6 per barrel
- The corresponding downtrend in SPY, line a, is at $132.50, which is well above current levels. On Monday, SPY got very close to the resistance from the June lows at $126.30
- On September 16, crude oil completed its bear flag formation (point 1), which was four days before SPY violated its corresponding uptrend
- Both crude oil and SPY reversed to the upside on October 4
- SPY has 38.2% support at $118.65 with the 50% support at $116.65
NEXT: Long Entries for Two Oil Industry ETFs
|pagebreak|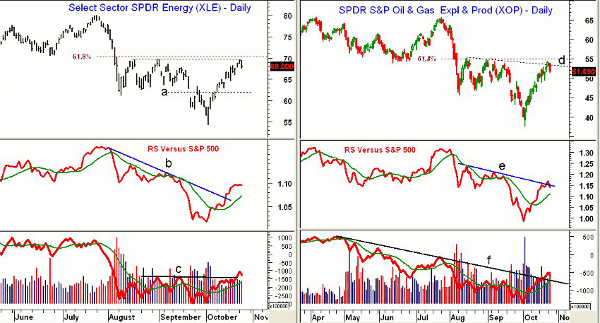
Click to Enlarge
On Monday, the Select Sector SPDR - Energy (XLE) reached the twin highs from August before turning lower. The 61.8% retracement resistance is just a bit higher.
- There is further resistance for XLE in the $74-$75 area
- Initial support for XLE stands at $65-$66 with the 50% retracement support from Monday's highs at $62
- The relative performance, or RS analysis, broke its downtrend, line b, just over a week ago. The weighted moving average (WMA) is also rising, suggesting a significant low may be in place
- The RS needs to hold its weighted moving average and then turn up to suggest that XLE is starting to outperform the S&P 500
- Daily on-balance volume (OBV) did not make new lows in October and has now broken through resistance at line c. It is acting stronger than prices
- Weekly OBV (not shown) did not make new lows in early October and has moved above its flat weighted moving average. It could complete a bottom in the next few weeks
The SPDR S&P Oil & Gas Exploration & Production ETF (XOP) closed Monday above the downtrend (line d) from the August highs before dropping on Tuesday. With the 61.8% retracement resistance at $55, this was not a positive sign.
- There is stronger resistance in the $58-$60 area
- The RS line shows a similar pattern as seen in XLE, as it just barely broke its downtrend, line e, before reversing direction
- It is above its weighted moving average, but is acting weaker than the RS on XLE
- The daily OBV has overcome its longer-term downtrend, line f, and is above its rising weighted moving average
- The weekly OBV (not shown) looks a bit stronger
- The 38.2% support from Monday's highs is at $48 with the 50% support at $46
What It Means: The backwardation in the crude oil futures contracts is consistent with an economy that is stronger than many believe. Clearly, the GDP numbers due out on Thursday will have a short-term impact.
The bullish readings from the Advance/Decline (A/D) line continue to suggest that any corrections should be brief, and if that is the case, then these two oil ETFs should hold the 38.2%-50% support levels and surpass Monday's highs.
How to Profit: For the Select Sector SPDR - Energy (XLE), go long at $64.38 with a stop at $61.76 (risk of approx. 4%).
For the SPDR S&P Oil & Gas Exploration & Production ETF (XOP), go long at $48.74 with a stop at $45.66 (risk of approx. 6.3%).


