Both companies turned out solid earnings that beat Wall Street estimates, but only one shows a decidedly bullish chart structure and would be a good buy on a decent pullback.
A sharp jump in debit card use helped MasterCard, Inc (MA) report a 38% increase in third-quarter earnings on Wednesday. The stock closed up 7.3%. Debit card use was up 23% and company earnings at $5.63 per share were well above the average analyst estimate of $4.81 per share.
Visa (V) released earnings last week, and though the company reported a 14% jump in profits that exceeded analyst estimates, the revenue number missed. Visa also appears to be losing the debit card war with MasterCard, as the company reported a much smaller increase in debit card use.
MasterCard has outperformed Visa so far this year, but will this continue? Let’s take a look at the weekly and daily charts.
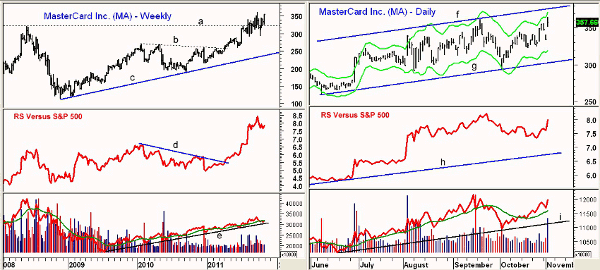
Chart Analysis: The weekly chart of MasterCard, Inc. (MA) shows that it traded as low at $113.05 in late 2008 and made an all-time high in September at $361.94.
- In August, MA surpassed the highs from May 2008 (line a), which was consistent with its strong long-term uptrend (line c)
- The weekly chart shows that the break through resistance, line b, in the $253 area, signaled the most recent surge
- Weekly relative performance, or RS analysis, confirmed the price breakout by moving above its resistance at line c
- The RS line has made significant new highs this year, which is positive for the intermediate term
- The on-balance volume (OBV) is in a well-established uptrend, line e, but is still well below the 2008 highs
- The weekly Starc+ band is currently at $380
The daily chart shows a broad trading range, lines f and g, which goes back to June. MA is close to the daily Starc+ band with the upper trend line now at $376.
- The RS line has turned up sharply after forming a peak in September. It is still well above the daily uptrend, line h
- Volume was heavy on Wednesday and the OBV has turned up sharply. It is still slightly below the September high, but well above long-term support (line i)
- There is initial support now at Tuesday’s low ($333.36) with stronger support in the $322.50-$324.50 area
NEXT: Latest Chart Analysis for Visa (V); How to Profit
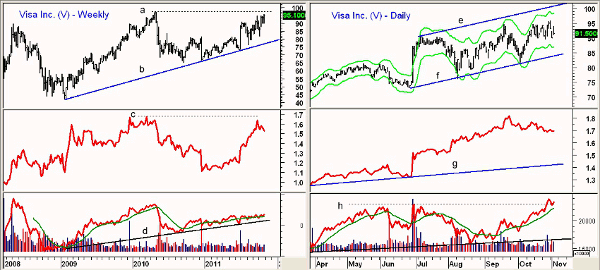
|pagebreak|Visa Inc. (V) has made a series of higher lows and higher highs this year. The long-term uptrend, line b, is in the $77.40 area.
- V is still below the 2010 high at $96.82, line a, with the weekly Starc+ band now at $101.90
- The weekly RS line is positive, having made higher highs so far this year. It has not yet broken out above the highs from early 2010, line c
- OBV shows an uptrend going back to the 2009 lows, but has not yet moved above the 2010 highs
Visa was only able to move slightly above the September highs at $94.75 in October. Once above last week’s high at $95.87, the daily Starc+ band is at $98.49.
- The upper boundary of the trading channel, line e, is now at $100.95
- The RS line has been drifting lower since September but has not formed a definable downtrend
- The OBV has just moved above the resistance at line h but is lagging behind the price action
- There is first support at $89.60-$90 with the daily Starc- band at $86. The weekly Starc- band is at $79
What It Means: The changes in the laws regarding debit cards will likely challenge both MasterCard and Visa over the next year. Technically, there is no question that MasterCard looks much stronger.
There are two especially positive factors for MA that I would like to point out. The first is that MA has been able to surpass its 2008 high, and secondly, the RS analysis is acting much stronger than prices.
RS analysis often does a good job of projecting future price strength or weakness. Earlier this year, it was forecasting further weakness in the financial sector.
How to Profit: Given the recent sharp gains, it is difficult to control the risk on new long positions in MasterCard, Inc. (MA) at current levels. Look for a pullback towards the $308-$320 area over the next month or two. The $290 level needs to hold on a closing basis to keep the uptrend intact.


