A closer look at key market internals seeks to clarify the ongoing debate about whether the October rally was an enticing “bull trap,” or if the latest sharp decline was a “bear trap.”
Tuesday’s selling in the stock market was quite vicious, but most stocks made their lows on the opening and then closed well off the worst levels. The selling reinforced the worst fears of many market analysts, who quickly cast doubt on the October stock market rally.
The sharp rebound on Thursday has clearly surprised many, and a nervous market now heads into the monthly jobs report. Sentiment has turned more bullish over the past few weeks, as 40.1% of the individual investors in the American Association of Individual Investors (AAII) survey are bullish, up from a low on September 22 of 25.3%.
Recent data from financial newsletter writers shows that 43.2% are bullish, and the bull-to-bear ratio has risen to 1.17. That ratio made a two-year low on October 12 at 0.74. This supports the case that the October lows were significant.
Still, the debate goes on as to whether the October rally was a “bull trap” that enticed investors into the market so the rug can be pulled out from under them or if Tuesday’s drop was a ”bear trap.”
In a bear trap, investors are scared out of their stock positions on a sharp market drop and some are convinced to go short, only to have the market reverse course and move sharply higher.
A move above last week’s highs is needed to indicate that Tuesday’s drop was a bear trap, while the S&P 500 would need to close below the 61.8% Fibonacci support level at 1158 to suggest that the October rally has failed. Let’s take a look at the market internals to see if they can help clarify the debate.
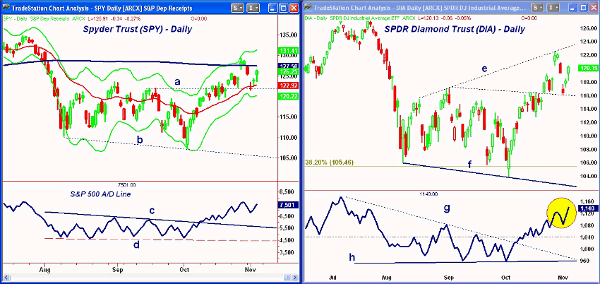
Chart Analysis: The Spyder Trust (SPY) closed below the 20-day exponential moving average (EMA) on Tuesday, hitting a low of $121.52 and testing support from the September highs (line a). SPY held above the 38.2% retracement support at $121.02.
- It was the severity of the drop that surprised everyone since just a few days earlier, SPY traded as high as $129.43
- The flat 200-day moving average (MA) is at $127.50 and a close above this level would be positive
- There is further resistance at $128.40, and once above the recent highs, the daily Starc+ band is at $131.41
- The S&P 500 Advance/Decline (A/D) line broke out of its trading range (lines c and d) well ahead of SPY, which was a bullish sign
- The A/D line has turned up and a move above the prior highs will project an upside breakout in prices
- If Tuesday’s lows are broken, there is further support at $119.20 with the 50% retracement support at $118.43
The SPDR Diamond Trust (DIA), which tracks the Dow Jones Industrial Average, has rebounded more sharply than SPY, closing Thursday well above the 200-day MA at $119.56. The daily chart shows that the breakout level (dashed line) was just tested on Tuesday, which is classical technical action.
- There is resistance from the recent highs at $122.23-$122.48 with trend line resistance at $123.56 (line e)
- In July, DIA traded as high as $127.37
- The Dow Industrials A/D line surged on Thursday and has moved to new highs (see circle), which is very bullish action because it reaffirms the A/D line’s uptrend
- It would now take a drop below Tuesday’s low to weaken the A/D line
- The low on Tuesday was $116.03, as DIA held above the 38.2% retracement support at $115.48
NEXT: Latest Chart Action for More Index ETFs; How to Profit
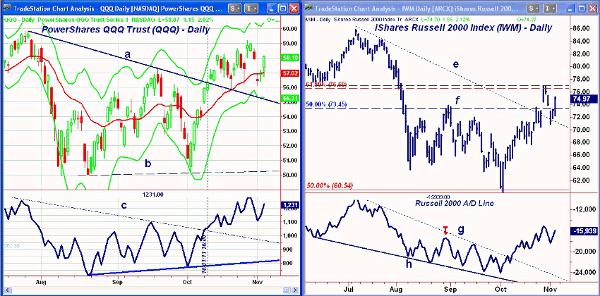
|pagebreak|The PowerShares QQQ Trust (QQQ), which follows the Nasdaq 100 Index, also dropped below its 20-day EMA on Tuesday, hitting a low of $56.12. The prior low was at $55.79 with the 38.2% support at $55.73.
- There is next resistance at $58.64-$59.21 with the daily Starc+ band at $60.51
- The Nasdaq 100 A/D line held above its prior lows and has turned up. It is still below its prior high, which is the key level to watch
- The break through the downtrend in the A/D line (line g) on October 11 was a sign that the market had turned
- If the 38.2% support is broken, the 50% support stands at $54.66
The iShares Russell 2000 Index Fund (IWM) has been one of the best performers recently, having rallied more than 28% from the October lows to last week’s highs.
- Tuesday’s low was $70.96, which was above the 38.2% retracement support at $70.53. The 50% support stands at $68.54
- IWM has next resistance at $76.98, which is also the 61.8% retracement resistance level from the April highs
- The Russell 2000 A/D line broke out of its declining wedge formation (lines g and h) just a few days after the October lows
- The A/D line is still in a clear uptrend and a move above the prior high would be bullish
- The relative performance, or RS analysis (not shown), is very close to completing its bottom formation
What It Means: The new rally high in the Dow Industrials’ A/D line is a bullish sign, and it will be important for the other A/D lines to surpass their recent highs as well. The NYSE A/D line is currently very close to making new highs.
For the S&P 500, a move to the 1300 level still looks likely, and the Dow Industrials could test resistance in the 12,750 area.
How to Profit: The monthly jobs numbers were released early Friday and the report appears to be mixed, but futures were trading lower before the opening.
I continue to favor buying stocks in the strong sectors when they pull back to support and the risk can be well identified. Those sectors with the best RS analysis are still the areas that I am watching most closely.
Our buy levels in the railroad stocks were hit on Tuesday’s opening. The improving relative performance of the small-cap stocks means they may also be good area for future new buying.


