Strong Black Friday sales have recharged the bullish outlook for the retail sector, and these three stocks have controlled risk and big upside potential if the rally continues.
The major averages closed last week just above the key 61.8% Fibonacci support before rocketing to the upside on Monday, spurred on by much-better-than-expected Black Friday shopping.
Over the past several months, many economists had painted a bleak outlook for consumer spending. For example, in late September, the chief US economist at Mizuho Securities, Steven Ricchiuto, said, "What you’re basically getting is a scene where consumers are losing momentum, they’re losing momentum on income, and as a result of that, they’re slowing down on spending.”
Even the National Retail Federation was forecasting just an average holiday shopping season in early October. This was in contrast to the technical action of the retail stocks, which were already starting to outperform the S&P 500. In an October 5 article (see “3 Best Buys in Retail Apparel”), I discussed how the Dow Jones Retail Apparel Index was much stronger than the S&P 500.
The current bullish outlook for the retail sector makes three additional retail stocks attractive buys at current levels.
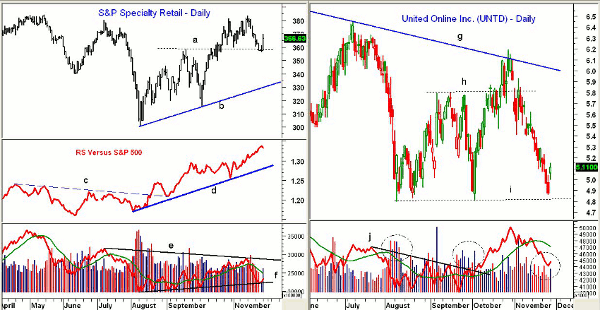
Chart Analysis: The S&P Specialty Retail Index hit a high of 383.54 on November 14, which was very close to the all-time highs at 383.31.
- The recent pullback retested the breakout level (line a) last week. The correction in this group was much less severe than what was seen in the major averages
- There is stronger support in the 345 area with the daily uptrend, line b, near 337
- The relative performance, or RS analysis, broke out to the upside in late August when it surpassed resistance at line c. The RS shows a strong uptrend, line d
- The selling on the recent correction was fairly heavy, as the daily on-balance volume (OBV) dropped below its weighted moving average (WMA) but is holding support at line f
- The OBV needs to move above resistance at line e to signal significantly higher prices
United Online Inc. (UNTD) is a $455 million specialty retailer that is not widely known. It is the parent company of several familiar brands, however, including FTD, Classmates, and NetZero. The shares currently yield 8.2%.
- The daily chart shows that UNTD appeared to complete a double-bottom formation when it overcame resistance at line h
- UNTD failed to close above the daily downtrend, line g, in October, and fell sharply towards the prior lows
- It made a low of $4.80 in August, $4.81 in October, and hit low of $4.86 on Friday (Nov. 25). This creates a strong level of support
- The stock gapped higher on Monday with first resistance at $5.40 and then at $5.80
- There is key resistance in the $6.00-$6.20 area
- Volume was lower each time UNTD dropped below $5, which is characteristic of a sold-out market
- The OBV did break its downtrend (line j) very soon after the October lows and confirmed the recent highs
NEXT: More Low-Risk, High-Reward Retail Plays
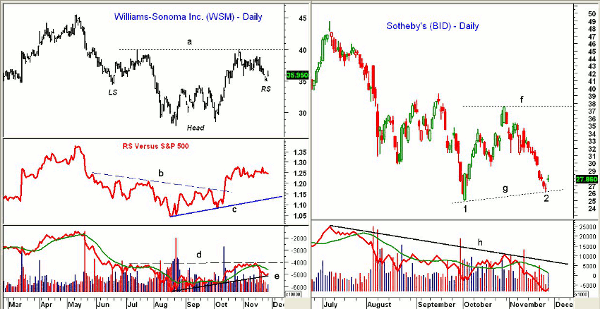
|pagebreak|Williams-Sonoma Inc. (WSM) is a well-known, $3.7 billion company whose shares yield 1.9%. The daily chart appears to show a reverse head-and-shoulders (H&S) bottom formation with the neckline at $40, line a.
- The early-2011 highs were at $45.48 and a decisive close above the neckline will project a move to the $52-$53 area
- The daily RS analysis completed its bottom formation in October when it broke the downtrend, line b, and developed a pattern of higher highs and higher lows
- The OBV also appears to show a reverse H&S bottom with resistance at line d
- There is now initial support at last week’s lows at $34.50-$35 and then at $33
Sotheby’s (BID) is a $1.8 billion company whose shares may have completed a double-bottom formation last week, forming slightly higher lows, line g.
- There is initial support now in the $26.20 area with stronger support at $25 and the October lows
- Next resistance is in the $31-$32 area with much stronger resistance in the $37.50 area, line f. Just above this level is the September high at $39.28
- The daily OBV is negative and still below its downtrend, line h
- Raw volume numbers were the heaviest in August and have since formed lower highs, which gives a more positive outlook
What It Means: The strong Black Friday sales numbers helped to vindicate the bullish outlook for consumer spending that I’ve been discussing since late September. The action the rest of this week will help determine whether Monday’s action was a just an oversold bounce.
A strong weekly close will support the view that the correction is over, and new longs in these three stocks have well-controlled risk and significant upside potential if the bullish outlook is correct.
How to Profit: For United Online Inc. (UNTD), go 50% long at $5.09 and 50% long at $4.96 with a stop at $4.72 (risk of approx. 6%). Cancel the order if $5.45 is hit first.
For Williams-Sonoma Inc. (WSM), go 50% long at $35.76 and 50% long at $35.22 with a stop at $32.88 (risk of approx. 7.3%).
For Sotheby’s (BID), go 50% long at $27.86 and 50% long at $27.24 with a stop at $25.94 (risk of approx. 5.8%). Cancel the order if $29.05 is hit first.


