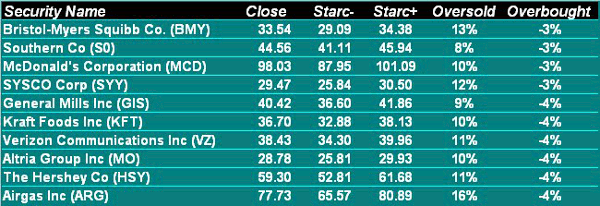
Even after a strong two-week rally, these standout S&P 500 stocks have yet to reach extreme overbought levels and are likely to outperform the broad market in the event of a pullback.
With the S&P 500 up over 8% in the past two weeks, it is important to know which stocks in the index are overbought and whether any are still oversold. The most objective way I have found to measure this is by comparing the weekly or monthly closing price to the Starc band readings.
Over the years, I have found that buying a stock when it is above its weekly Starc+ band is generally a mistake. More often, if I am fortunate to be long a stock that moves above its weekly Starc+ band, it’s best to take some profits.
As noted in “Red Flags Preceded Gold’s Drop” the SPDR Gold Trust (GLD) stayed above its Starc+ band for several weeks before it dropped sharply.
In all of the S&P 500, Bristol-Myers Squibb Co. (BMY) is the most overbought, but as the table indicates, it is still 3% below its weekly Starc+ band. All of the ten most overbought stocks are well-known names, and you will note that there is a high concentration of consumer staples stocks included.
The four stocks I have selected from the list have the most positive relative performance, or RS analysis patterns. This means that they are performing better than the S&P 500 and are likely to drop less severely than the overall market during one of the all-too-frequent sharp market corrections we’ve been experiencing. Each of the four stocks also pays attractive yields.
NEXT: See Latest Chart Pattern for Bristol-Myers Squibb |pagebreak|
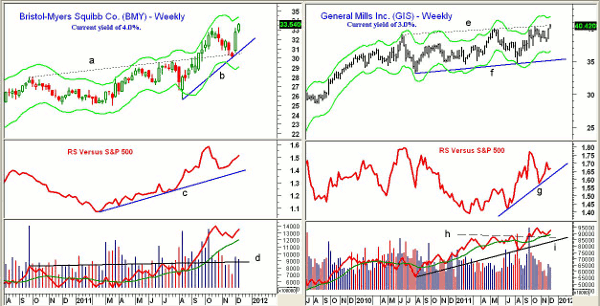
Chart Analysis: Bristol-Myers Squibb Co. (BMY) dropped sharply the week ending November 25 after testing major weekly support, line a, in the $30 area before rallying sharply.
- BMY has already surpassed the late-October highs, which clearly indentifies it as a market leader
- The major 38.2% retracement resistance calculated from the 1999 high of $75.37 is at $38.50
- RS analysis turned positive in the spring of 2011 and is in a well-established uptrend, line c
- On-balance volume (OBV) also looks very strong as it overcame long-term resistance at line d in September
- There is initial support now at $32-$32.75 with the weekly uptrend, line b, at $31
General Mills Inc. (GIS) is a $26 billion company whose shares closed right on major trend line resistance (line e) at $40.43. This resistance goes back to early 2010.
- The trading range (lines e and f) is $5.60 wide, giving an upside target in the $46 area
- RS analysis completed its bottom formation in August while the market was under pressure
- Weekly OBV broke out through long-term resistance (line h) in September, just two weeks before the market bottomed in early October
- Weekly OBV has long-term support at line I, while the daily OBV (not shown) looks very strong
- There is first support at $40 with further support at $39-$39.40
NEXT: 2 More S&P Leaders to Watch
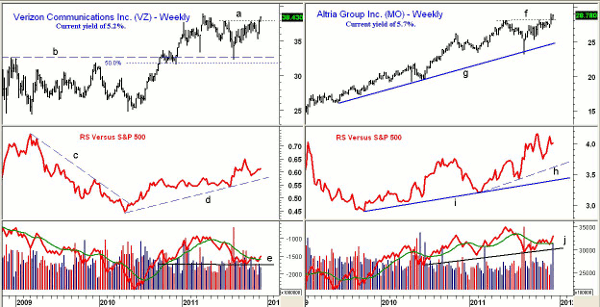
|pagebreak|Verizon Communications (VZ) closed above several-month resistance, line a, two weeks ago, and added to the gains this past week. There is further resistance at $38.95, which was the April 2011 high.
- VZ hit a high of $43.02 in October 2007 and has major 61.8% Fibonacci retracement resistance at $47
- The downtrend in the weekly RS analysis was broken in the middle of 2009, and the stock has been in a strong uptrend since (line d)
- Weekly OBV did confirm the April highs but is currently lagging the price action. It is slightly above its weighted moving average (WMA) and has held support at line e
- VZ dropped as low as $32.28 in August when the long-term support at line b was tested. The decline held well above the major 50% retracement support at $31.86
- There is first good support now at $36.50-$37.50
Altria Group Inc. (MO) shows a similar breakout as Verizon, having closed well above the weekly resistance at $28.20. There is first good support now at $26.80-$27.30.
- The long-term uptrend, line g, was slightly broken in August, though not on a closing basis
- RS analysis continues to look strong, showing a pattern of higher highs. Initial support stands at line h with longer-term support at line i
- Volume was quite strong last week and has moved well above its flat WMA. So far, the OBV has not yet confirmed the breakout
- Upside targets from the chart are in the $31-$32 area
What It Means: It is a positive sign for the market that after such a good two-week run, stocks are not more overbought as measured by the weekly Starc+ band analysis. It should also be pointed out that the strong weekly RS analysis on all four stocks makes them well worth watching.
How to Profit: General Mills Inc. (GIS) is the only one of the four stocks that currently looks attractive for new positions. Go 50% long at $40.06 and 50% long at $39.72 with a stop at $37.18 (risk of approx. 6.8%).


