
Those who were frightened by news out of Europe and dumped gold this week could soon wind up sorry, as a known seasonal period of strength for the metal is right around the corner.
Once again, the European debt crisis hit global stock markets on Monday, but share prices are trying to stabilize early Tuesday. Even though the major US stock market averages lost around 1.5%, the gold market was hit even harder, as the SPDR Gold Trust (GLD) was down over 3% and February Comex gold futures dropped by over $48 per ounce.
The stronger US dollar got the majority of the credit for gold’s decline, while raising cash at any price to protect against the euro’s demise was also a popular explanation. This conflicts with the view that more aggressive European Central Bank (ECB) action will increase inflationary expectations.
The demand outlook is also mixed, and while the world’s central banks bought more gold in the third quarter than at any time in the past 40 years, there were also concerns that emerging market demand has dropped sharply.
Technically, Monday’s drop looked more like panic selling. As mentioned in my recent seasonal report (see “4 Key Seasonal Trends for 2012”), gold prices typically top out in February.
Looking at the short-term seasonal pattern, gold often bottoms around December 22, which is just eight trading days away, and although the short-term momentum is currently negative, now is still the time to keep a close eye on gold prices.
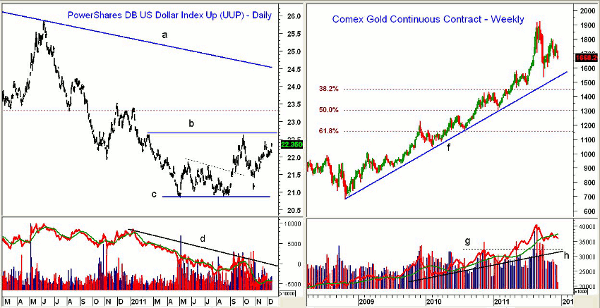
Click to Enlarge
Chart Analysis: The PowerShares DB US Dollar Index Bullish Fund (UUP) gapped higher on Monday but is still well below the October highs (line b) in the $22.32 area.
- The major 38.2% Fibonacci retracement resistance calculated from the 2008 high at $27.19 is at $23.30
- The long-term downtrend, line a, is now at $24.50
- Daily on-balance volume (OBV) looked reasonable in August when UUP long positions were recommended, but it dropped sharply over the past two months and now shows a well-established downtrend, line d
- There is first support now at $21.90-$22 with stronger support at $21.60
The weekly chart of the continuous Comex gold futures shows that these contracts are down just over 13% from the September highs. Judging by past corrections in the gold market, this decline has not yet been that severe.
- There is next support in the $1600-$1630 area and then at the September panic lows of $1535, which correspond to the long-term uptrend, line f
- The major 50% retracement support is at $1300
- Weekly OBV only formed a minor divergence at the recent highs, and more importantly, the monthly OBV did confirm the highs
- This volume action is consistent with a positive major trend
- OBV is below its weighted moving average (WMA) but shows major converging support (lines g and h)
NEXT: Latest Chart for Gold ETF GLD; How to Profit
|pagebreak|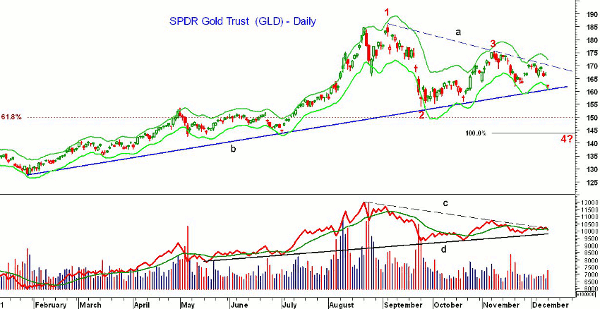
Click to Enlarge
The daily chart of the SPDR Gold Trust (GLD) shows that the flag, or triangle formation, is still intact even thought prices stalled at the downtrend, line a. Monday’s low took prices back to the daily Starc- band as well as the support at line b.
- A break of this support would not invalidate the intermediate-term bullish outlook but could signal a drop to the $154-$156 area
- There is further chart support at $153, which corresponds to the May highs
- The 61.8% Fibonacci retracement support, as calculated from the early-2011 lows, is at $150
- We can also calculate an equality targets by using the decline from point 1 to point 2 and measuring down from the high at point 3, thus giving a target in the $143.50 area
- Though I did not expect this severe a decline, it would certainly push the bearish sentiment to extreme levels
What It Means: Though the odds favor a further decline in gold before the correction is over, I am not impressed by the dollar’s rally. Further dollar strength could challenge more important resistance and trigger another drop in gold prices.
Though gold prices do not have to bottom before the end of the year, prices should be moving higher by mid-January. There is also a slight chance that the worst of the decline is already over and two consecutive 1%-2% daily gains could reverse the trend.
How to Profit: Long-term position holders should use a stop in GLD under $140, but I would not advise new long positions until we get clear positive signals from the technical studies like the on-balance volume. Definitely do not be tempted by the gold miners at this time either.
As previously recommended, buyers should be long the PowerShares DB US Dollar Index Bullish Fund (UUP) at $21.18. Raise the stop on that position to $21.57 at this time.


