For investors willing to wait on a pullback to present a favorable buying opportunity in coming sessions, these three stocks show clear chart patterns, pay safe yields, and represent strong sectors.
In Friday's Week Ahead column, I recommended that investors be patient and not chase stocks, as a good buying opportunity should be presented in the next week or two.
Though this is my still my favored outlook, over the weekend, it became a bit too popular, as several analysts who I myself respect, including Barron’s Michael Santoli, warned about “The Dangers of Complacency.”
Though the FOMC announcement this Wednesday could be a good excuse for a market correction, it is tough to tell how much higher it could go before it corrects.
Nevertheless, I think it is wise to have a plan in place and your buy levels identified so that you'll be prepared when the correction does unfold. Many of the most promising stocks and ETFs have completed or are forming reverse head-and-shoulders (H&S) formations.
In my first trading lesson of 2012, I picked this as the “dominant chart pattern” for early 2012, and this has not changed. In addition to their chart patterns, these three stocks in particular also have nice yields, and one is a well-known name that should benefit if the agricultural commodities are strong later this year.
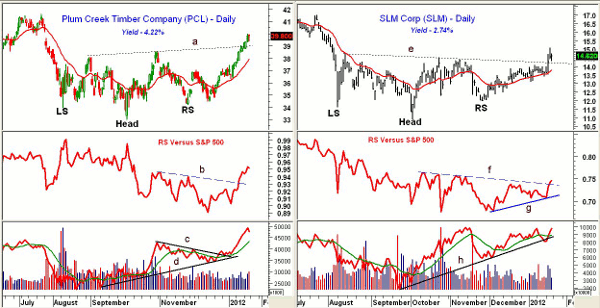
Chart Analysis: Plum Creek Lumber Company (PCL) is industrial REIT that has a capitalization of $6.42 billion. It has had nice run from the October 4 lows at $33.02.
- PCL closed above the neckline (line a) of the reverse head-and-shoulders bottom formation last Wednesday (Jan. 18)
- The left shoulder (LS) low at $34 was just a bit below the right shoulder (RS) low of $34.22
- PCL hit a high of 44.28 in April 2011
- The upside target from the reverse head-and-shoulders bottom formation is in the $44-$45 area
- The relative performance, or RS analysis, has completed its bottom formation by moving through resistance at line b
- The on-balance volume (OBV) has also been strong, as it formed a bullish divergence at the lows (line d) and broke through its downtrend, line c, in December
- It is well above its moving average, which could be tested on a pullback
- Initial support now stands in the $38.60-$39.20 area with much stronger support in the $37-$37.70 area
- The 20-day exponential moving average (EMA) is at $37.96
SLM Corporation (SLM) is a credit services company that provides educational financing in the United States. It is a $7.4 billion company with a current yield of 2.74%.
- SLM traded as high as $17.11 in May 2011 and hit a low of $10.91 in October, which formed the head of the reverse head-and-shoulders bottom formation
- The neckline (line e) was surpassed last week and the completed formation has upside targets in the $18 area
- The RS analysis has just broken through resistance, line f, and shows a nice uptrend (line g) from the early-December lows
- The OBV is strong and formed a short-term positive divergence at the October lows (line h). It has been acting stronger than prices
- Initial OBV support lies at the uptrend with stronger support at the December lows
- First support now stands in the $14-$14.30 area with further support at $13.40-$13.80
- The 20-day EMA is at $13.71
NEXT: Popular Agriculture Stock Looks Attractive Now |pagebreak|
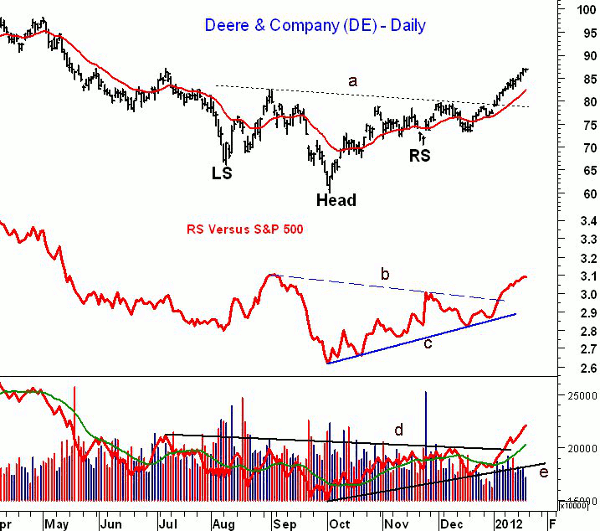
Deere and Company (DE) is a well-known manufacturer of farm and construction machinery founded in 1837. The stock currently yields only 1.9%, as it is up sharply from the October low at $59.92. It reached a high in 2011 of $99.80.
- DE completed its reverse H&S bottom formation in early January when it gapped through the neckline (line a)
- The upside target from this formation is in the $98-$100 area
- The RS analysis has confirmed the price action as it moved through resistance, line b, when DE broke out to the upside. Strong RS support is at line c
- The OBV has also completed a major base formation, moving through resistance (line d) that goes back to early July
- The OBV is well above its rising weighted moving average (WMA) and support at line h
- Both the weekly OBV and RS analysis (not shown) is also strong
- Initial support now stands in the $83 area with stronger support between $80 and $82. The rising 20-day EMA is currently at $82.41
- The neckline is now just above $78
What It Means: Though too many people may now be looking for a pullback, from a risk/reward standpoint, that is still the best strategy. However, the major market averages could still go higher first, and potential targets for the S&P 500 are in the 1335-1350 area.
Some sectors like the homebuilders are already correcting, and these three stocks look attractive at current levels.
How to Profit: For Plum Creek Lumber Company (PCL), go 50% long at $39.22 and 50% long at $38.44 with a stop at $35.90 (risk of approx. 7.5%).
For SLM Corporation (SLM), go 50% long at $14.22 and 50% long at $13.74 with a stop at $12.94 (risk of approx. 7.2%).
For Deere and Company (DE), go 50% long at $83.44 and 50% long at $82.44 with a stop at $77.62 (risk of approx. 6.4%).
Portfolio Update
For previously recommended long positions in Coca Cola Inc. (KO), raise the stop to $66.06 at this time.


