Reverse head-and-shoulders bottom formations in three stocks and an emerging market ETF are creating worthwhile buying opportunities for traders and active investors.
Stocks have put in a powerful performance so far in 2012, which has raised the hopes of many shell-shocked investors. The stock index futures are lower in early-Monday trading, however, as Greek leaders have failed so far to reach a debt deal with private sector creditors.
This may be the start of the market correction I have been looking for, and if it is, it should provide investors with some good entry points as long as they know how to take advantage the dominant chart pattern for 2012.
In early December, I noted that the iShares FTSE China 25 Index Fund (FXI) and the iShares MSCI Hong Kong Index Fund (EWH) both appeared to be forming reverse head-and-shoulders (H&S) bottom formations.
Prior to year end, I noticed that this chart formation was prevalent that across many sectors, and in an early-January Trading Lesson, I explained how to capitalize on these formations.
The pattern is still dominating the market, and last week, two steel stocks and the Select Sector SPDR - Materials (XLB) completed reverse H&S bottom formations.
Once the formation is completed, additional opportunities often develop, and that is the case with the stocks discussed in the original article. One of the four stocks has met my buy criteria and the position now needs to be managed. I have new recommendations for two other stocks and an emerging market ETF as well.
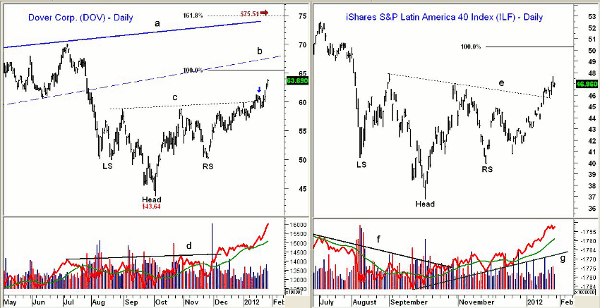
Chart Analysis: Dover Corporation (DOV) is an $11 billion industrial company that currently yields 2.0%. On January 19, DOV closed at $60.85, which was above the $60.60 level that I felt was needed to complete the reverse H&S bottom formation. My recommended buying zone of $59.90-$60.25 was easily reached over the next two days when DOV traded as low as $58.88.
- The move back above the prior highs at $61.28 confirmed the breakout
- The equality target, or 100% Fibonacci price target using the rally from the October lows is at $65.39
- There is former support, now trend line resistance (line b) in the $68 area
- Additional chart resistance is at $74 with the upside target from the reverse H&S formation at $75.51
- On-balance volume (OBV) has been leading prices as it broke through resistance at line d in early December
- First good support now stands at $58.88-$61
The iShares S&P Latin America 40 Index Fund (ILF) closed above the neckline of its reverse H&S formation, line e, on January 18. The additional resistance at $47.05 was subsequently overcome.
- The major 61.8% Fibonacci retracement resistance level is at $48.27 with further chart resistance at $49.50
- The 100% Fibonacci price target is at $50.24 with the reverse H&S target at $56.70
- The daily OBV broke its downtrend, line f, in late October and is now in a strong uptrend
- The neckline is now at $45.80 with further support in the $44.50-$44.80 area
NEXT: 2 More Equities with Tradable Bottom Formations
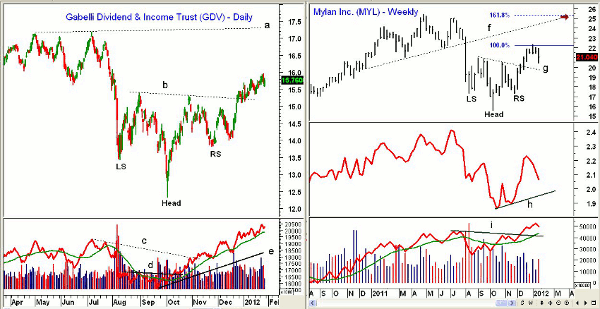
|pagebreak|The Gabelli Dividend and Income Trust (GDV) is a closed-end equity fund that has a current value of $1.3 billion and yields 6.1%.
- The neckline at $15.24 (line b) was overcome on December 23, completing the reverse H&S bottom
- The recent high has been $15.96 and the July high was $17.19. The upside target from the H&S formation is at $18.30
- The OBV bottomed ahead of prices when it moved through resistance at line d in October and further resistance in November (line c)
- The OBV continues to look very strong, as it is well above support at line e
- There is first support at $15.50 with stronger support at $14.80-$15.10
Mylan, Inc. (MYL) is a generic drug maker that has rallied sharply from the October low at $15.49 and hit a high of $22.32 just three weeks ago. The reverse H&S bottom formation was completed December 12.
- The recent high just met the 100% Fibonacci target before MYL turned lower
- There is further resistance at $23.52-$23.68 with the H&S target at $25.42
- On the weekly chart, you will note that this level also corresponds to the former uptrend, line f, and the 161.8% Fibonacci target
- Weekly relative performance, or RS analysis, completed its bottom in December when it formed higher highs
- Weekly OBV looks very strong and has moved well above the 2011 highs, line i. It is acting stronger than prices
What It Means: Recognizing reverse H&S bottom formations will allow you to trade as the formation is being completed, but the formation can often give excellent additional buying opportunities as well.
Given the overnight selling in the futures market, I wanted to adjust the orders that had not yet been filled and update the stop levels for the open position in Dover Corp. (DOV).
How to Profit: For Mylan, Inc. (MYL), go 50% long at $20.24 and 50% long at $19.98 with a stop at 19.18 (risk of approx. 4.6%).
Buyers should be long Dover Corp. (DOV) at $60.25 or better as previously recommended. Raise the stop now to $58.56 and sell half the position at $65.16.
Alongside my previous recommendation for the iShares S&P Latin America 40 Index Fund (ILF), I noted, “Because this is a rather volatile ETF, I would look to buy at $46.12 only after two consecutive daily closes above $46.50 or better.” That order has not been filled, and buyers can now go 50% long at $45.06 and 50% at $44.44 and use an initial stop at $41.44 (risk of approx. 7.6%). Sell half the position at $51.60 or better.
The Gabelli Dividend and Income Trust (GDV) never got to the initial buy level at $15.28. Buyers can now go 50% long at $15.28 and 50% long at $14.93 with a stop at $13.92 (risk of approx. 7.8%).


