This monthly scan is helpful for identifying which popular Dow stocks are too risky for new buying, but it also turns up a pair of compelling buy candidates in the process.
The stock market’s best January performance since 1997 has certainly changed the outlook of many investors. In January 1997, the S&P 500 gained 6.1% versus 4.4% in 2012. In 1997, the S&P 500 rose another 4% and peaked on February 22 before starting a seven-week decline that took the index below the prior year’s close.
However, historical analysis does indicate that if stocks are higher in January, they finish the year higher 86% of the time. In 1997, the S&P 500 finished the year 31% higher. An equal gain in 2012 would have the S&P 500 closing at 1646.
Given January’s strong stock market performance, it is not surprising that few Dow stocks are oversold. There are quite a few that are getting closer to their monthly Starc+ bands, however, and the proximity of a stock’s monthly closing price to its Starc bands is one of the most reliable ways to identify overbought and oversold stocks. (For more on Starc bands, please read “Buy, Sell, or Wait: A Way to Decide.”)
As the above table of the Dow’s ten most overbought stocks indicates, seven are now within 10% of their monthly Starc+ bands. For February, the monthly Starc+ band of the Dow Industrials stands at 13,623, which is 7% above its January close.
In addition to identifying stocks that are in the high-risk zone for new buying, the bands have also been very effective in identifying favorable investing opportunities, and this month, there are two stocks that look particularly attractive.
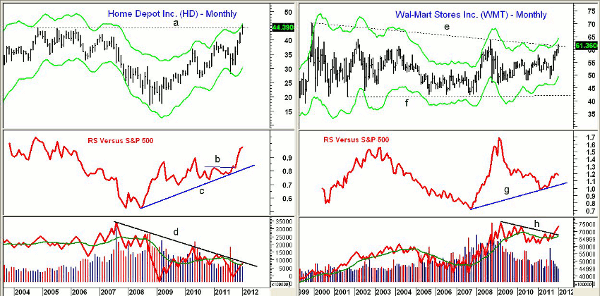
Chart Analysis: Home Depot Inc. (HD) tops the list this month and was second last month. It gained 5.6% for the month, closing at resistance that goes back to 2004, line a.
- The monthly Starc+ band is at $45.72 and HD has next major resistance (from 2002) at $52.60
- Monthly relative performance, or RS analysis, broke through resistance (line b) in September and is in a long-term uptrend, line c
- The on-balance volume (OBV) has failed to confirm the price action, as it has formed a series of lower highs, line d. This makes me nervous given the close proximity to the upper Starc band (Starc+)
- HD has first good support in the $42.50 area with additional support in the $40 area
- HD dropped below its monthly Starc- band last July when it hit a low of $28.13
Wal-Mart Stores Inc. (WMT) is just over 5% below its Starc+ band and has additional resistance from the September 2008 high at $63.85.
- More importantly, WMT looks ready to break out of a 12-year trading range, lines e and f. In 2010, IBM broke out of a similar multi-year trading range that projected a move to $185-$192, which has since been met
- The upside targets for WMT are in the $84-$88 area
- Monthly RS has formed higher highs, line g, and a move above the 2010 highs would be further confirmation of a new uptrend
- Monthly OBV looks very strong, as it has broken its downtrend, line h, and is well above its rising weighted moving average (WMA)
- There is minor support at $60.30 with further support in the $59 area. Long-term support stands in the $55.50-$56.50 area
NEXT: Important Signals from Intel (INTC) and Caterpillar (CAT); How to Profit
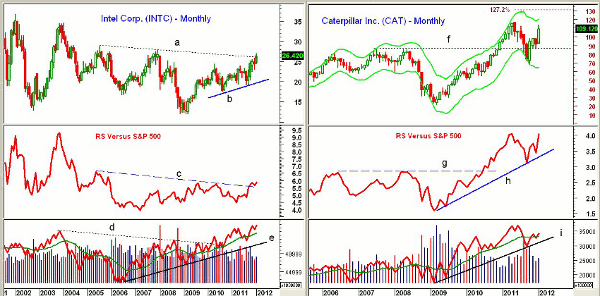
|pagebreak|Intel Corp. (INTC) is 9.6% below its monthly Starc+ band, but the monthly chart shows a bullish monthly close above multi-year resistance, line a, that goes back to 2005.
- The monthly Starc+ band coincides with the 2007 and 2005 price highs at $29-$28.90
- INTC traded as high as $34.60 in 2004
- The monthly RS line broke through its long-term resistance, line c, in October
- Monthly OBV broke through its resistance, line d, in 2010, and is acting much stronger than prices. It shows a powerful uptrend, line e
- There is initial support at $26 with more important support in the $24.80-$25.50 area
Caterpillar Inc. (CAT) broke through major resistance, line f, at the end of 2010. CAT then rose to a high of $116.55 in 2011 and then fell back to a low of $67.54. This took CAT below the monthly Starc- band last July.
- After the Starc+ band at $120.94, the 127.2% Fibonacci price projection target is at $131.50
- The monthly RS analysis also looks strong after breaking through resistance in 2010 ahead of prices. It retested support, line h, and is now close to new highs
- OBV did confirm the 2011 highs and held support at line i during last year’s correction. It is now back above its weighted moving average
- CAT has traded in a wide range this week with a low of $104.45 and further support in the $102 area
What It Means: This regular monthly scan of the Dow, while intended to identify the most overbought or oversold stocks, also allows me to focus on the monthly charts and technical studies. These signals can be very powerful, and the long-term RS analysis can often identify the year’s star performers (see “The Year’s Most Reliable Indicator”).
I previously recommended several of the stocks on this list (updates below), and two stocks, Wal-Mart Stores (WMT) and Caterpillar (CAT), now look most favorable for initiating new positions.
How to Profit: For Wal-Mart Stores (WMT), go 50% long at $59.60 and 50% long at $58.80 with a stop at $56.22 (risk of approx. 5%).
For Caterpillar (CAT), go 50% long at $104.10 and 50% long at $102.76 with a stop at $95.55 (risk of approx. 7.6%).
Buyers who are long Home Depot Inc. (HD) should consider hedging the position with a covered call strategy.
Portfolio Update
- For Intel (INTC), buyers should be 50% long at $23.24. Raise the stop to $24.43 and consider adding a 50% long position at $25.66 using the same stop.
- For Pfizer Inc. (PFE), buyers should be long from $17.03. Half the position was sold at $21.48 and the stop was raised to $19.24.
- For Kraft Foods (KFT), buyers should be 50% long at $34.54 and using a stop at $34.52.
- For International Business Machines (IBM), buyers should be 50% long at $178.72 with a stop at $176.32.
- For Coca-Cola Co. (KO), buyers should be long at $66.24 or better with a stop at $66.32. Sell half the position at $68.62 or better.


