
Poor recent performance and heavy bearish sentiment shouldn’t overshadow the technical signals that this risky but potentially explosive growth industry could be bottoming.
While hopes for a sustainable economic rebound continue to grow, the potential demand for rare earth metals has not impressed investors. Clearly since the frenzied highs of early 2011, the supply of rare earths has increased, but the weakening in the Chinese economy has dampened demand.
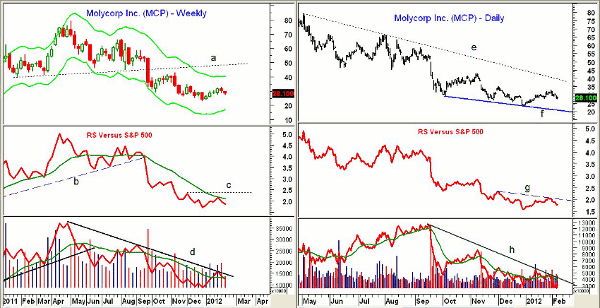
Industry giant Molycorp (MCP) rose from a low of $12.10 in 2010 to a high in May of $79.16. It hit a low in December 2011 of $23.05. Last fall, even though the technical action in the overall stock market was positive, this group continued to look weak, as I noted in a November column (see “Avoid the Rare Earth Stocks”).
The rare earth frenzy in 2010 was clearly overdone, and the bearish sentiment on this group is now quite high. The recent poor action of this group may convince some that the economic recovery is not for real, but there are early technical signs that suggest the group may be ready to bottom in the next month or so.
Click to Enlarge
Chart Analysis: The weekly chart of Molycorp (MCP) shows the break of major support, line a, last September. The downtrend is still intact on the weekly chart, as the recent bounce is still below the November high at $34.95.
- There is further resistance in the $42.90-$48.70 area (line a)
- The uptrend in the relative performance, or RS analysis, line b, was broken in September, confirming the weak price action
- The RS line is still below its declining weighted moving average (WMA) and needs to move through resistance at line c to suggest that a bottom is in place
- Weekly on-balance volume (OBV) broke its uptrend in June, warning of lower prices
- The OBV made new lows in December but has improved sharply from the lows. Though the OBV is still below its downtrend, line d, it could form a positive divergence on new lows in the next few weeks
- The weekly Starc- band is now in the $17 area
The daily chart of Molycorp (MCP) also looks negative, and once below the recent lows at $23.05, the lower trend line support, line f, is in the $20 area
- The daily RS line has formed lower highs (line g) and lower lows, which is consistent with a further decline
- Daily OBV is acting weaker than prices and needs to move through its steep downtrend (line h) and the late-2011 highs to improve the outlook
- The daily chart currently shows resistance at $32.94 and then at $34.95
NEXT: Chart Pattern Suggests This Group Could Bottom Soon
|pagebreak|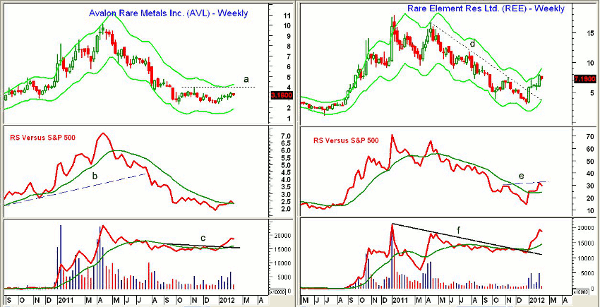
Click to Enlarge
Avalon Rare Metals Inc. (AVL) is a small-cap Canadian company that explores for and mines rare earth metals. The weekly chart shows that it has been in a trading range since the September 2011 low of $2.29.
- There is resistance now at $3.50-$4.00 (line a) with the weekly Starc+ band now at $4.23
- The downward momentum in the RS analysis seems to be subsiding, as the weekly RS did move above its weighted moving average in late January. A move above the recent highs would be positive sign
- The weekly OBV does look better, as it broke through resistance, line c, in the middle of January. A successful test of the weighted moving average would be positive
- There is initial support now at $2.94-$3.05 with further support at $2.70
Rare Element Resources Ltd. (REE) is another small-cap gold and rare earth mining company that has rallied sharply from its late-December lows at $3.08. It recently hit a high of $8.02. Though this could be attributed to short covering, the short ratio of 3.5 is not excessively high.
- The break of the weekly downtrend, line d, is a positive sign, and next chart resistance stands at $9.00
- The major 50% Fibonacci retracement resistance from the 2011 high at $17.92 is now at $10.60
- The weekly RS line has moved back above its weighted moving average, which has now flattened out. A close above resistance at line e would be a positive sign
- Weekly OBV has broken its downtrend, line f, as there has been a surge in volume over the past five weeks. It is well above its rising weighted moving average
- There is initial support now at $6.50 with stronger support in the $6.00 area. A drop below the $4.80 area would suggest a test of the lows.
What It Means: The action in Rare Element Resources Ltd. (REE) may indicate that the group is bottoming, so the first pullback should be watched closely. Molycorp (MCP) is clearly the weakest of these three rare earth stocks.
Though the fundamental outlook for rare earth minerals is cloudy at best, the wide swings in investor sentiment make this an attractive group for the very speculative part of any portfolio.
How to Profit: For Rare Element Resources Ltd. (REE), aggressive investors should go 50% long at $5.66 and 50% long at $5.18 with a stop at $4.77 (risk of approx. 12%).
I will be keeping an eye on both Molycorp (MCP) and Avalon Rare Metals Inc. (AVL) as well.


