
Seasonal strength in the energy sector means good opportunity in select oil and gas stocks as winter melts into spring.
Even though the small-cap stocks had been correcting since the early February highs, the iShares Russell 2000 (IWM) was the best performer last week, gaining 1.87%. This beat out the 1.5% gains in the Spyder Trust (SPY) and the PowerShares QQQ Trust (QQQ).
Once again, the large-capitalization stocks in the Dow are lagging, as the SPDR Diamond Trust (DIA) was only up just over 1%.
In spite of last week’s nice gains, the overall stock market continues to show a loss of upside momentum, as the Advance/Decline lines for both the Nasdaq-100 and the Russell 2000 have failed to make new highs with prices. The daily volume analysis also suggests that last Wednesday’s reversal may coincide with a short-term top.
Overseas markets are showing nice gains, as expectations grow that Greece will reach a debt deal Monday. Asian markets were also higher in reaction to a further cut in bank reserves by the People’s Bank of China.
An alternative to the 3% to 5% correction in the major averages I have been expecting could be a continued sector rotation, such as what recently occurred in the railroad stocks. For example, Union Pacific (UNP) has dropped close to 8% from the early February highs.
If the market internals again break out to the upside, then a sector strategy, rather than a market focus approach, will be a better idea.
The improvement in the relative performance, or RS analysis, of the energy sector, plus the strong volume action in the crude oil futures, indicates that energy stocks are likely to be market leaders over the coming months. The seasonal pattern reveals that crude oil typically bottoms in February.
Click to Enlarge
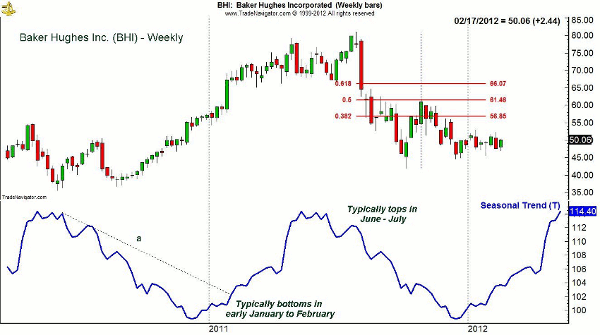
Chart Analysis: Baker Hughes (BHI) is a $21.9 billion oil and gas services company that peaked last July at $80.99, and hit a low of $41.93 in September.
- The weekly chart shows a trading range over the past nine weeks, with first weekly resistance at $52.20-$53.
- The 38.2% Fibonacci retracement resistance is at $56.85, with the 50% resistance level at $61.46.
- The seasonal trend analysis going back to the 1980s shows that BHI typically bottoms in January-February, as the break of the downtrend (line a) indicates.
- BHI then generally rallies until the early summer, typically topping in the June-July period.
NEXT: Another Driller with Strong Potential
|pagebreak|
Click to Enlarge
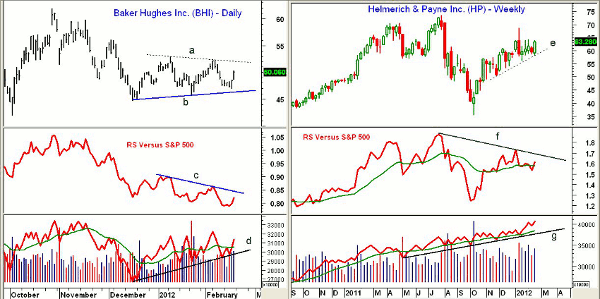
The daily chart of BHI shows the gap higher Friday and the strong close, as volume was well above average. This increases the likelihood of a breakout of the daily trading range, lines 1 and 2.
- Next daily chart resistance at $52.24, with further levels at the December high of $56.11.
- The RS analysis has turned up but is still below its downtrend, line c.
- The daily on-balance-volume (OBV) looks much stronger, as it shows a clear pattern of higher lows, line d, and is back above its WMA.
- The weekly OBV (not shown) is clearly positive. It is already close to last summer’s highs.
- There is minor support now at $49-$49.50, with further at $48.60 to $48.20.
Helmerich & Payne, Inc. (HP) is a $6.8 billion oil and gas drilling and exploration company that bottomed in October at $35.58. It has since been in a solid uptrend, line e.
- There is next resistance at $64.36, with more important levels at $68.60.
- HP had a high in July 2011 of $73.40.
- The weekly RS line has moved back above its WMA, which is a positive sign…but it now needs to overcome the downtrend, line f.
- The weekly OBV is acting much stronger than prices, as it is already making new all-time highs.
- HP gapped higher Friday and closed strong on heavy volume. Initial support now at $60.42 to $61.57 with further at $59.60.
What it Means: The technical action in the oil and gas drilling equipment and exploration companies suggests they are going to be leading the energy sector higher.
Friday’s strong action in these two stocks makes the entry a bit harder, especially if the Greek debt problems are favorably resolved before Tuesday’s opening.
How to Profit: For Baker Hughes (BHI), go 50% long at $49.62 and 50% long at $48.76, with a stop at $45.28 (risk of approx. 7.9%).
For Helmerich & Payne (HP), go 50% long at $61.78 and 50% long at $60.66, with a stop at $55.82 (risk of approx. 8.8%).


