Technical signals in some of the S&P’s strongest stocks indicate now is a high-risk time to buy but also validate the market-leading potential in these shares.
Risk, to me, is the key for every investment decision, and that is why it always comes first when I am buying or recommending a stock or ETF. Starc band analysis plays an important role in my selection process, as often times it will convince me that the risk in buying is not attractive.
While the Spyder Trust (SPY) is still 4% below its weekly Starc+ band, there are many stocks that are uncomfortably close to their weekly Starc+ bands. This is in contrast to last October (see “The Most Oversold Dow Stocks”) when Caterpillar Inc. (CAT) was the most oversold stock.
CAT closed September 30 at $73.84, which was just 0.3% above the monthly Starc- band at $73.64 and then dropped to a low of $67.54 on October 4. CAT hit a high last Friday of $116.95.
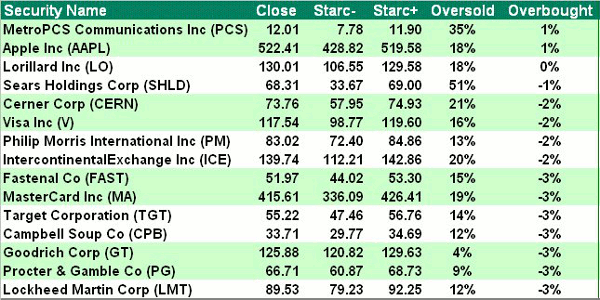
If you are looking to take some profits on long positions, Starc band analysis can also be a useful tool. The above table lists the 15 stocks in the S&P 500 that are closest to their Starc+ bands. For example, MetroPCS Communications (PCS), which surged last Friday following news that its acquisition by Sprint Nextel Corp. (S) had fallen through, closed at $12.01, which was 1% above the weekly Starc+ band at $11.90.
Let’s look at PCS and three of the S&P’s other most overbought stocks.
NEXT: Latest Chart Pattern for MetroPCS Communications (PCS)
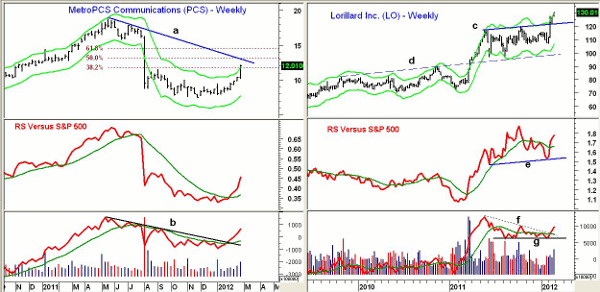
|pagebreak|Chart Analysis: MetroPCS Communications (PCS) is a $4.35 billion wireless communications carrier whose stock made a high in 2011 at $18.79 and a low last fall at $7.51.
- PCS has closed above the 38.2% Fibonacci retracement resistance with the 50% resistance at $13.15.
- The relative performance, or RS analysis, turned positive in early February when it moved above its weighted moving average (WMA)
- Volume has been increasing for the past two weeks, and the on-balance volume (OBV) has clearly broken its downtrend, line b
- A pullback in the OBV back to its weighted moving average should be a good buying opportunity
- There is first good support for PCS at $10.50 with stronger support in the $9.50 area
Lorillard Inc. (LO) is a $17.2 billion tobacco company that pays a dividend of $6.20 for a current yield of 4.8%. The weekly chart shows the breakout of the $20 trading range, line c, two weeks ago.
- LO has been at or above its weekly Starc+ band for the past three weeks
- The upside target from the breakout is in the $140-$144 area
- The RS line has started a new uptrend and has moved above its weighted moving average and its prior high
- The OBV shows the completion of a triangle formation, lines f and g. The OBV has not yet confirmed the price highs
- There is minor support at $127 with further support at $122.50
NEXT: Overbought Signals in More S&P-Leading Stocks
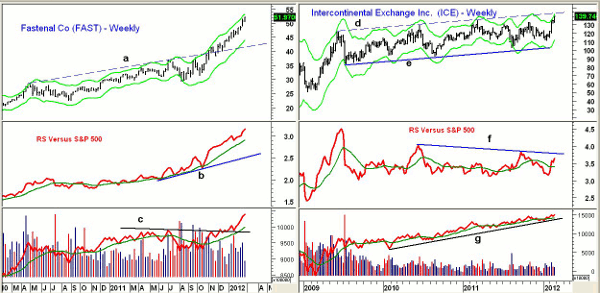
|pagebreak|Fastenal Co. (FAST) is a $15.3 billion company that sells building and construction materials on both a wholesale and retail level. FAST hit a low of $29.14 in August 2011 and broke through weekly resistance, line a, in early November.
- FAST has been close to its weekly Starc+ band for the past two weeks and is now well above the monthly Starc+ band at $47.63
- The RS analysis has been in a strong uptrend since the latter part of 2010 and has accelerated to the upside recently
- OBV confirmed the breakout as it moved through resistance at line c. It has also confirmed the recent highs
- There is minor support in the $50 area with stronger support at $46-$47.50
Intercontinental Exchange Inc. (ICE) is a $10.1 billion operator of regulated exchanges and over-the-counter (OTC) markets. The weekly chart shows a long-term trading range since the middle of 2009.
- The move above the October highs at $132.89 signaled a breakout of the recent trading range
- There is resistance at $143.60 (line d) and support in the $133 area, line e.
- The RS line has moved back above its weighted moving average but is still below the resistance at line f
- The OBV looks much stronger and has been making higher highs since early in 2010. It has solid support at line g
- There is some support now at $135 with stronger support in the $130-$133 area
What It Means: While the close proximity to the weekly Starc+ bands is most useful in identifying high-risk areas to buy and low-risk areas to sell, it can also help to provide an early reading on new market leaders.
The two most interesting charts in this group are those of Lorillard Inc. (LO) and Intercontinental Exchange Inc. (ICE), as the completion of the weekly trading ranges creates a floor under prices.
Fastenal Co. (FAST) is likely to continue as a market leader in 2012, but only look to buy after it develops a new trading range or corrects below $44.
Apple Inc. (AAPL) is near the top of the overbought list, as it has rallied back to its reversal highs, which I still think marks a short-term top.
How to Profit: The stock index futures are a bit lower in early trading, but as noted in Friday’s Week Ahead column, it will still take a close below certain key levels to complete a short-term top.


