Several prominent S&P 500 stocks haven’t been bid up to technically overbought conditions in the recent rally, potentially leaving room for more upside potential ahead.
Even though the stock market has had very impressive gains this month, there are still a number of stocks that are trading close to their weekly Starc- bands. The closeness to the Starc band can be used to determine whether a stock is a high-risk buy or a high-risk sell.
Read “Buy, Sell, or Wait: A Way to Decide” for more on trading with Starc bands.
When a stock is trading near its weekly, or more importantly, the upper monthly Starc band (Starc+), it is an indication that it is mathematically extended (overbought) and is therefore a high-risk buy. Of course, it can get even more overbought, but this analysis can help the investor or trader assess the risk of a new position.
Conversely, if a stock is closer to its lower weekly or monthly Starc band (Starc-), it can help identify stocks that are mathematically in the low-risk buy area or are oversold. Starc band analysis can also be used to help spot those stocks that are performing weaker or stronger than the overall market.
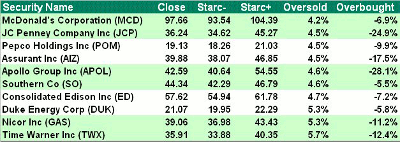
The table above reflects data through the close on Friday, March 16, when McDonald’s (MCD) closed at $97.66, only 4.2% above its weekly Starc- band at $93.54. By comparing the closing price to both weekly Starc bands, you can get a different perspective of the relative price. For example, JC Penney Co. Inc. (JCP) is 4.5% above its weekly Starc- band, but is 24.9% below its weekly Starc+ band.
Each week, after I run these scans, I then take a closer look at the stocks on the list to see if there are new buying opportunities or if there are any stocks that should be liquidated or avoided. The majority of the stocks on this week’s list look as though they are likely to get even closer to their Starc- bands before potentially turning around.
NEXT: Chart Analysis for McDonalds (MCD) and JC Penney (JCP)
|pagebreak|
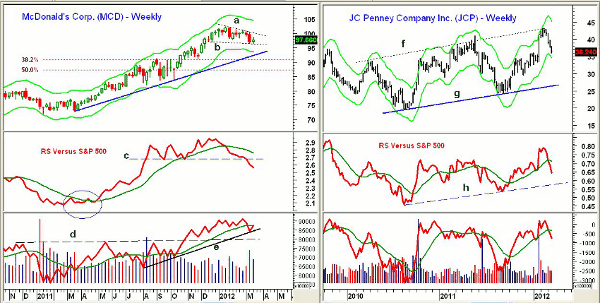
Chart Analysis: McDonald’s (MCD) broke support at $98.80 two weeks ago and is now trying to hold further support in the $96 area. The weekly chart shows what appears to be a continuation pattern, lines a and b.
- On a break below $96, there is stronger support in the $93.50 area and the uptrend, line c
- The 38.2% Fibonacci support from the 2011 lows is at $91
- Weekly relative performance, or RS analysis, has broken support at line c, and is now below its declining weighted moving average (WMA)
- RS analysis bottomed in the spring of 2011 (see circle) and MCD turned out to be star performer in 2011
- The weekly on-balance volume (OBV) looks more positive, as it has turned up from its uptrend and is trying to close back above its weighted moving average
- A close back above $100.50 is needed to re-assert the uptrend and signal a rally to the $105 area
JC Penney Company, Inc. (JCP) has been hit hard over the past three weeks, as it reversed from the long-term resistance, line f, in the $43 area. The downgrade of its debt by Fitch on February 21 did not help, as JCP is down over 16% from its highs.
- The next band of chart support is in the $33.50-$35 area with the weekly Starc- band at $34.62
- The lower boundary of the broad trading range is in the $26 area
- RS line has reversed sharply and has dropped below its weighted moving average
- Weekly OBV did confirm the recent highs, but it has also dropped below its weighted moving average. Daily OBV (not shown) dropped below its weighted moving average on February 24
- There is initial resistance for JCP at $37.50-$38 with stronger resistance in the $40 area
NEXT: Searching More Oversold Stocks for Opportunities
|pagebreak|
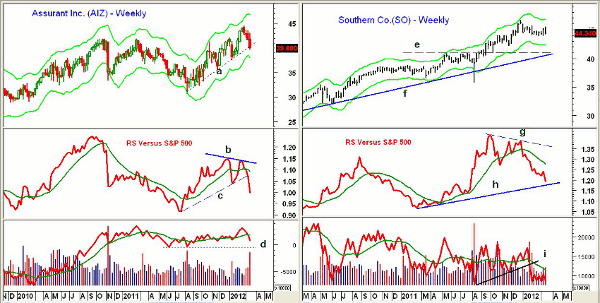
Assurant Inc. (AIZ) is a $3.5 billion accident and health insurance company that currently yields 1.8%. The close last week was below the uptrend, line a.
- Monday’s close was at the daily Starc- band
- AIZ is down over 10% from its highs with next important chart support at $37.58
- The RS line did not confirm the recent highs, line b, and has now broken its uptrend, line c. This pattern suggests a further decline
- Volume last week was heavy and the OBV has dropped below its weighted moving average with next important support at line d
- There is first resistance in the $41 area with much stronger resistance in the $42.30-$43 area
Southern Co. (SO) is one of the five utilities on the table, and they all have similar technical patterns. SO reversed last week, and a drop below the weekly support at $43.85 would be more negative.
- There is additional support at the November lows at $42.11, and the weekly Starc- band at $42.29
- More important converging support is in the $41 area, lines e and f
- RS line formed a negative divergence at the highs, line g, before dropping sharply below its weighted moving average
- The RS line has now reached stronger support
- Weekly OBV shows a very choppy pattern over the past two years. It dropped though its uptrend, line i, in January
- Initial resistance is at $44.50 with stronger resistance above $45
What It Means: Often times, I will find one or more stocks on the S&P 500’s most oversold list that have attractive relative performance and volume readings, which will then put them on my buy list. That is not the case this time, as even though I think McDonald’s (MCD) could break out to the upside and rally to the $105 area, the current risk/reward profile does not look favorable.
How to Profit: There are no new buy recommendations at this time.
Portfolio Update
- Cancel open orders in Procter & Gamble (PG)
- Close out the remaining 50% long position in Sotheby’s (BID) from $27.62
- Close out half of the position in Marvell Technology Group Ltd (MRVL) and use a stop at $14.66 on the remaining position
Find all of Tom’s market comments by bookmarking his columnist page.


