
The seasonal strong period for regional banks comes at a time when two in particular look ready to pull back, thus presenting very favorable buying opportunities.
The results of the banking stress tests last week gave both the major and regional banks a boost. As I discussed on Friday, the weekly relative performance analysis of the Select Sector SPDR - Financial (XLF) has completed its bottom formation. Therefore, this sector should continue to lead the market higher.
The stock market is coming under pressure this week, as the focus has now turned to concerns over weakness in the Chinese economy, as well as signs that Eurozone countries are still vulnerable.
The seasonal analysis for the SPDR KBW Bank ETF (KBE) indicates that it typically bottoms in March and then continues higher for the next two months. In reviewing over 40 regional bank stocks, many have reached significant resistance, and only a handful show volume patterns that suggest they will be able to break out to significant new highs over the next few months.
See also: The 4 Key Seasonal Trends for 2012
Regional banks are likely to correct over the next few weeks, which should present some good buying opportunities, particularly in these two regional bank stocks.
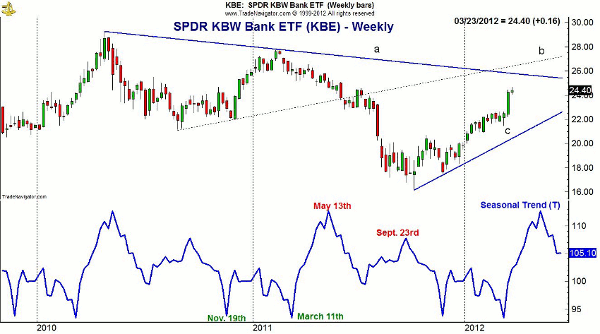
Click to Enlarge
Chart Analysis: The SPDR KBW Bank ETF (KBE) shows a nice uptrend from the October 2011 low, line c. It is still below the downtrend at $25.50 (line a).
- There is further resistance in the $26.50 area, line b
- Seasonal trend analysis shows that the KBE typically hits a low on November 19, which lines up nicely with the low made on November 25
- A secondary low comes in on March 11, with KBE typically rallying until May 13
- Daily and weekly on-balance volume (OBV) (not shown) are both positive and show no signs yet of significant tops
- Daily relative performance analysis overcame six-month resistance last week
NEXT: 2 Regional Banks to Buy on Upcoming Pullbacks
|pagebreak|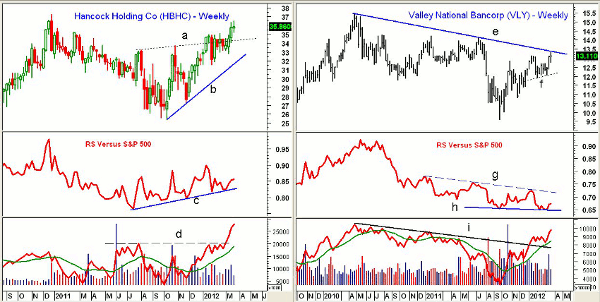
Click to Enlarge
Hancock Holding Company (HBHC) is part of the Southwestern regional bank group and has a capitalization of $2.99 billion. It currently yields 2.7%.
- HBHC made a high in late 2010 at $37.26 but traded as high as $45.86 in early 2010
- Relative performance, or RS analysis, shows a solid uptrend, line c, but shows no signs of upward acceleration
- OBV looks much stronger, having moved through major resistance, line c, in March
- OBV is well above its weighted moving average (WMA) but is overextended in the short term
- HBHC has first good support now in the $34.40 area, line a, with further support at $32.84
Valley National Bancorp (VLY) is a $2.4 billion bank holding company that is part of the Northeast Regional bank group. It currently yields 5.3% and has a pretty reliable dividend history. There also was a significant pickup in insider buying earlier this year.
- Weekly chart shows that the downtrend, line e, is now being tested
- The daily candle chart shows two long tails up to the $13.28 area, which is consistent with a market that is ready to pull back
- First support now in the $12.60-$12.80 area with more important support at $11.87-$12.05, line f
- The weekly relative performance is not impressive. While it has turned, it made slightly lower lows, line h
- A move through the RS resistance at line g is needed to turn it positive
- The OBV did move through its long-term downtrend, line I, earlier this year. It has bounced from its rising weighted moving average and is already close to its 2010 high
- The next upside target is at $14.13 and then the 2010 high of $15.41
What It Means: Both of these regional bank stocks look ready to pull back, and the strong volume action and positive seasonal trend suggests any corrections will be good buying opportunities.
How to Profit: For Hancock Holding Company (HBHC), go 50% long at $34.64 and 50% long at $33.76 with a stop at $32.58 (risk of approx. 4.7%). On a move above $36.20, raise the stop to $33.90 and sell half the position at $38.88.
For Valley National Bancorp (VLY), go 50% long at $12.68 and 50% long at $12.40 with a stop at $11.68 (risk of approx. 6.9%). On a move above $13.62, raise the stop to $12.32 and sell half the position at $14.28.


