Despite overall strong earnings from the financial sector, the recent price action in four big bank stocks suggests the sector is not yet ready to lead a new broadly based market rally.
This week’s earnings reports have certainly exacerbated the market volatility, and this is likely to continue. Compared to a year ago, the financial and utilities stocks have shown the best earnings per share (EPS) growth, up 17% and 14%, respectively.
The consumer discretionary sector is the only other area to show a double-digit gain in EPS, as it grew by just over 10%. The worst-performing sector in this respect has been consumer staples, where EPS is down over 9% compared to a year ago.
Though several financial companies including Capital One Financial (COF) and Regions Financial (RF) both beat estimates by over 80%, there have been quite a few disappointments. Bank of America (BAC) missed estimates by 75%, and overnight, Deutsche Bank (DB) reported sharply lower first-quarter profit. The company missed analyst estimates by over 16%, and the stock was down 5% in European trading.
Europe’s second-largest bank, Banco Santander (STD), also reported a 24% drop in profits, and its stock was down over 4% in early trading.
After the surprisingly sharp gains from the October lows, many have been looking for an opportunity to buy the big US banks. As I wrote in early April (see “Are Big Banks in Big Trouble?”), the technical action indicated they were vulnerable heading into potential credit downgrades that may come next month.
Even though these big banks are now getting closer to more important support, the relative performance, or RS analysis, still indicates they are acting weaker than the S&P 500. Therefore, more important support levels may be tested, and a turnaround in these stocks would be significant for the overall market.
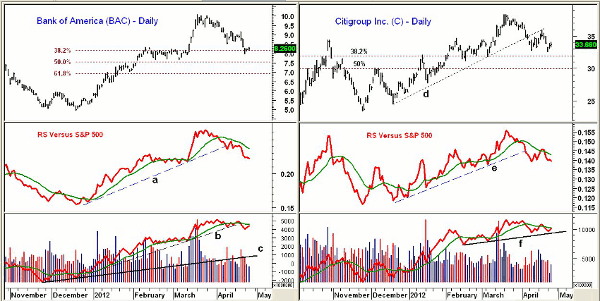
Chart Analysis: Bank of America (BAC) has closed lower for the past three weeks and is now down over 18% from the March high of $10.10. The 38.2% Fibonacci retracement support level at $8.13 has now been reached.
- The February lows are at $7.66 with the 50% retracement support level at $7.52
- Daily relative performance, or RS analysis, broke its uptrend, line a, on April 10
- BAC then traded sideways for just over a week before resuming its decline
- The RS line is in a downtrend and below its weighted moving average (WMA)
- On-balance volume (OBV) has violated its short-term uptrend, line b, but is holding up better than prices. The daily OBV has longer-term support at line c
- There is first resistance for BAC at $8.70-$9.20 and stronger resistance above $9.50
Citigroup, Inc. (C) violated its daily uptrend, line d, in early April after peaking at $38.40 in March. It is now down 12.3% from its highs with the 38.2% Fibonacci retracement support at $31.94.
- The more important 50% Fibonacci retracement support level is at $29.93
- The RS line broke its uptrend, line e, as the stock was breaking its price support
- RS line recently tested its declining weighted moving average before again turning lower
- Daily OBV is trying to hold above important support at line f. If broken, it would signal a much sharper decline. A move in the OBV above the most recent highs would be a positive sign
- There is initial resistance now in the $35-$36 area
NEXT: More Big Banks with Broad Market Significance
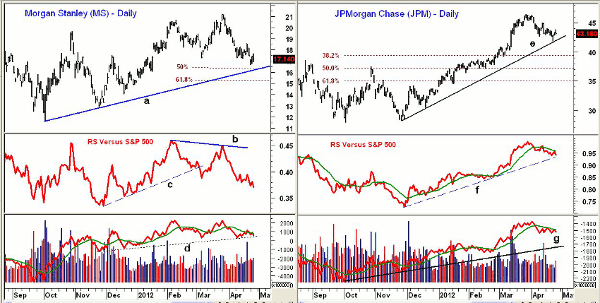
|pagebreak|Morgan Stanley (MS) has now dropped below the March low of $17.24 and is down 19% from the high at $21.19.
- The daily uptrend, line a, and the 50% Fibonacci retracement support level are at $16.37
- Relative performance, or RS analysis, broke its uptrend (line c) in March and then formed a negative divergence, line b, at the highs. The RS line is clearly in a downtrend
- Daily OBV did not confirm the March highs and is just above key support at line d. A break of this support will be a sign of further weakness
- There is daily resistance now in the $18-$18.50 area
JPMorgan Chase & Co. (JPM) tested its uptrend, line e, on Monday. From the March 27 high at $46.49, JPM is just down 7.3% and is holding up the best of these four banks.
- Once below Monday’s low at $41.80, the 38.2% Fibonacci retracement support level is at $39.46
- The 50% retracement support level is at 37.29
- The RS line dropped below its weighted moving average in early April and has formed a series of lower highs and lower lows. It is now testing its uptrend, line f
- Daily OBV has turned down from its weighted moving average but is still well above long-term support at line g
- There is first resistance for JPM at $45 and a close back above this level would be positive
What It Means: Once the stock market’s current correction is over, it is likely that the financial sector will again play a leadership role in the next major rally phase. Therefore, watching the action of these four big bank stocks may give us an early signal that the broad market is bottoming out. The current technical readings, however, suggest that the market’s decline is not yet over.
How to Profit: Because of the stronger technical pattern and 2.8% yield, JPMorgan Chase & Co. (JPM) will likely be the most important financial stock to watch, especially on a drop to the $40 area.


