Many of the most technically oversold stocks on the S&P 500 still look vulnerable to deeper corrections, but two in particular would be good buys at those lower levels.
With the Spyder Trust (SPY) down 3.6% from the April 2 high at $142.21 and testing its daily Starc- band, it is not surprising that some of the S&P 500 stocks are below or very close to their weekly Starc- bands. The proximity to the Starc bands can be used to determine whether a stock is a high-risk buy or a high-risk sell.
Read “Buy, Sell, or Wait: A Way to Decide” for more on trading with Starc bands.
During corrections within intermediate-term uptrends, the Starc band analysis can help identify stocks that are mathematically in the low-risk buy area or are oversold. Combining the relative performance and on-balance volume (OBV) analysis with the Starc bands can also identify those stocks that are outperforming or underperforming the overall market.
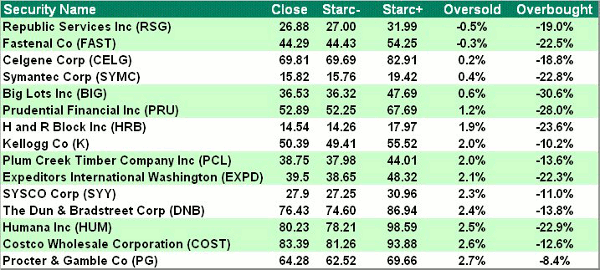
The table above reflects data through the close on Friday, May 5 and shows that Republic Services Inc. (RSG) and Fastenal Company (FAST) both closed last week below their weekly Starc- bands. The other technical readings reveal a sharp contrast between these two stocks, and the majority of the stocks on this week’s list look as though they are likely to decline even further before they could turn around.
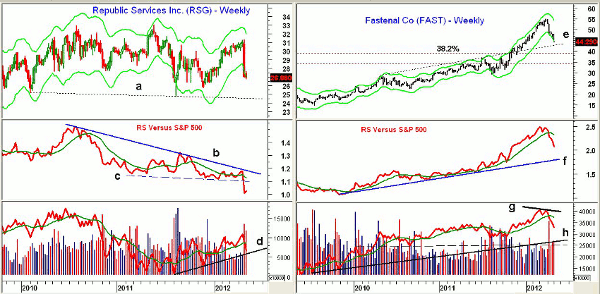
Chart Analysis: Republic Services Inc. (RSG) is a $9.9 billion waste management company whose stock was hit hard following earnings in late April. It is down over 14% in the past two weeks and currently yields 3.3%.
- The weekly chart shows next support at $25.78-$26.65 with major support at $24.50, line a
- Relative performance, or RS analysis, has been in a downtrend, line b, since the 2010 highs. The drop below support at line c indicates that it should continue to be weaker than the S&P 500
- Volume has been fairly heavy on the recent decline and the OBV is back below its weighted moving average (WMA). A break of the uptrend, line d, would be even more negative
- There is first resistance now at $28.50-$29.30
Fastenal Company (FAST) is a $12.9 billion seller of construction supplies (nuts and bolts) that is down over 20% from the late-March highs. At the end of March, FAST closed above its monthly Starc+ band, which for May is now at $56.60.
- There is next chart support in the $40-$42 area with the major 38.2% Fibonacci retracement support from the 2009 lows at $39. The monthly Starc- band is at $38.55
- The RS line formed a slight divergence at the highs and has since dropped well below its weighted moving average
- The longer-term uptrend in the RS, line f, is positive for the intermediate term
- Weekly OBV also formed a slight negative divergence at the highs, line g, and is now below its weighted moving average
- OBV is well above long-term support that converges at line h
- Initial resistance is at $46-$48
NEXT: An Attractive Dividend Stock to Buy at Lower Levels
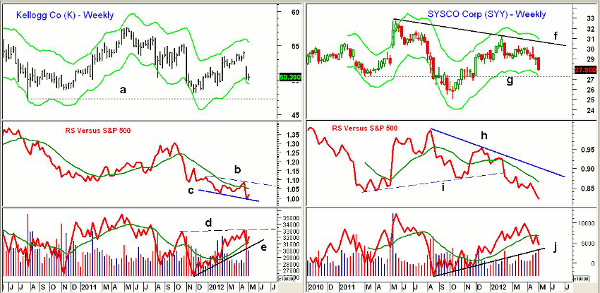
|pagebreak|Kellogg Co. (K) is the well-known, $18 billion food company that is part of the normally defensive consumer staples sector. It is just 2% above its weekly Starc- band and is down 6.7% from the pre-earnings high. The stock currently yields 3.4%.
- There is further support at $48-$49 with more important support in the $47.30 area, line a
- RS analysis has formed lower lows, line c. It needs to move above the resistance at line b to turn positive and signal that the stock is outperforming the S&P 500
- OBV is acting stronger as it has turned up from its weighted moving average and held above support at line e
- A move in the OBV above the resistance at line d would be even more positive
- There is resistance at the gap in the $52.04-$53.83 area
Sysco Corp. (SYY) is a $16.5 billion wholesale food company that yields 3.9%. It peaked at $31.18 in early February and is down 10.5% from the highs.
- There is next good support at $27.25, line g, which corresponds to the weekly Starc- band
- The RS line broke below important support, line i, in February and warned of the recent weakness
- The downtrend in the relative performance, line h, indicates SYY has been weaker than the S&P 500, and the recent drop suggests further weakness ahead
- OBV has just tested its flattening weighted moving average and turned lower, which is a negative formation. A break of the uptrend at line j would be more negative
- There is initial resistance at $29 with further resistance at $30.60 and the downtrend, line f
What It Means: In reviewing all 15 stocks on the most oversold list, I was somewhat surprised that the majority looked as though they were still vulnerable to further weakness. This suggests that the market may indeed drop to more important support.
Two of the stocks would be attractive at lower levels. The first is Fastenal Company (FAST), where I like the longer-term trend of the relative performance, which suggests a major top is not yet complete. The second is Kellogg Co. (K) which is an attractive and apparently safe dividend stock that is likely to be a good defensive addition to any portfolio.
How to Profit: For Fastenal Company (FAST), go 50% long at $42.28 and 50% long at $40.04 with a stop at $38.08 (risk of approx 7.4%).
For Kellogg Co. (K), go 50% long at $49.74 and 50% long at $48.54 with a stop at $46.88 (risk of approx 4.6%).
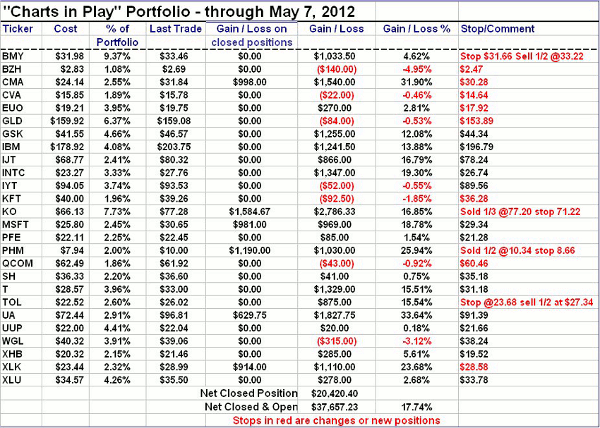
NEXT: View the Latest “Charts in Play” Portfolio
|pagebreak|


