Once the market bottoms, sector rotation could give rise to new market leaders, including a pair of sector ETFs that are now looking to rally off potential bottom formations.
Though some industry groups are outperforming the S&P 500, as tracked by the Spyder Trust (SPY), there are also quite a few that are acting weaker.
Some analysts are looking for the weakest industry groups to become the new leaders once the market finally bottoms out. The iShares PHLX SOX Semiconductor Sector Index Fund (SOXX) and the SPDR S&P Oil & Gas Exploration ETF (XOP) underperformed during the first-quarter rally and have been much weaker since the start of April. This makes these funds and their respective industry groups ones that should be watched closely.
Both funds reversed nicely alongside the stock market on Wednesday, but the volume and relative performance analysis needs to improve sharply to signal that an important low is in place. One looks attractive for a short-term trade, although longer-term investors should wait for more evidence before buying.
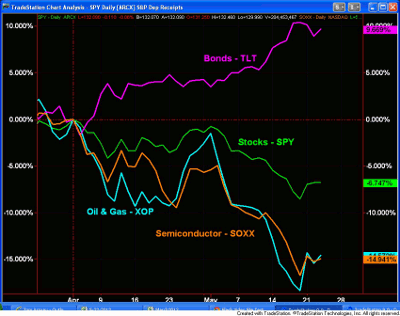
Chart Analysis: The percentage change chart shows the relative performance of the iShares Barclays 20+ Year Treasury Bond Fund (TLT) and the Spyder Trust (SPY) along with the iShares PHLX SOX Semiconductor Sector Index Fund (SOXX) and the SPDR S&P Oil & Gas Exploration ETF (XOP) since the start of April.
- In less than two months, the difference in performance is striking, as TLT is up 9.9% while SOXX is down 14.8%, a difference of 24.7%
- XOP is now down just over 13%, and both it and SOXX have bounced from the lows last week, as XOP was briefly down more than 17% and SOXX 16.8%
- These two ETFs have been twice as weak as SPY, which is currently down just over 6%
- On the chart, also note that in early April, TLT (in pink) dropped below both SPY and XOP but surged back above them on April 5
- This resurgence was a positive sign and reflected the sharp improvement in the relative performance for TLT
- The relationship of SOXX and XOP to SPY should be watched closely for signs of a legitimate turnaround
NEXT: One ETF May Rally Off a Short-Term Bottom
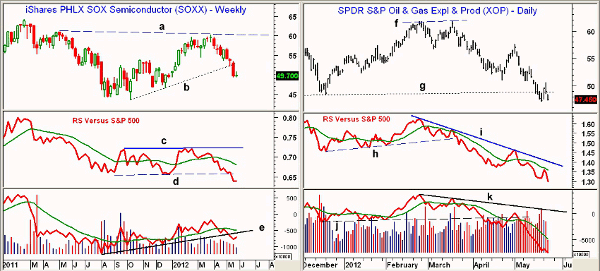
|pagebreak|The iShares PHLX SOX Semiconductor Sector Index Fund (SOXX) retested the resistance from the spring of 2011 in the $60 area, line a, in March before turning lower.
- SOXX closed decisively below its uptrend (line b) last week. Next support is in the $46.60 area, which represents the lows from late last year
- In October 2011, SOXX traded as low as $43.54
- Relative performance, or RS analysis, dropped below its weighted moving average (WMA) in early April and has now broken more important support at line d
- Weekly on-balance volume (OBV) has also broken its uptrend, line e, and is below its declining weighted moving average
- XOP rebounded on Wednesday to close up for the day on the best volume seen in several weeks
The daily chart of the SPDR S&P Oil & Gas Exploration ETF (XOP) shows that the fund made marginal new highs on March 19 at $61.81, line f, before reversing to the downside.
- The break below the March lows at $57.64 completed the top. This level also acted as resistance in early May
- RS analysis formed a negative divergence in March (line i) when it did not make new highs with prices
- RS line completed its top on March 21 when support at line h was violated. The RS has continued to make lower lows and shows no signs yet of a bottom
- Daily OBV also formed a negative divergence at the highs (line k) and then broke important support (line j) in April
- Volume was heavy in early May, and the OBV has dropped to significant new lows
- The December lows at $48.38, line g, were broken last week
- Wednesday’s daily reversal is a short-term positive sign with initial resistance now in the $52-$53 area
What It Means: Both of these oversold ETFs reversed from their early lows on Wednesday to close higher for the day. This suggests that a short-term bottom may be in place, and the volume did pick up on the buy side.
The relative performance analysis does not yet indicate that a sustainable low is in place, but a decent rally is now likely. A very strong rally could form the basis for a sustainable bottom formation.
How to Profit: Short-term traders could buy the SPDR S&P Oil & Gas Exploration ETF (XOP) at $49.06 or better with a stop at $46.93 (risk of approx. 4.3%). If longs are established, sell half the position at $52.26 or better for a 6.5% profit and raise the stop to breakeven.
Cancel the order if $50.40 is hit first or if this order if not filled by the close on May 25.


